


Gold Outlook: 4,000 in Focus as Middle East Risks Build Ahead of the Weekend
Gold tests major support at 4,000 as Middle East tensions, crude oil and a stronger US dollar leave bulls searching for a catalyst.
Written by
Matt Simpson
Market Analyst
We’re heading into the final sessions of the week, and gold continues to hint at a bullish reversal. Admittedly, it also sits close to confirming its next leg lower, leaving a fine line between bullish and bearish scenarios around the 4,000 level—a key area the gold trading community is likely watching.
For a broader perspective, I recently published a couple of StoneX articles examining gold's seasonality in Q3 and market positioning. In a nutshell, seasonality tends to turn more supportive in July before strengthening further in August, delivering a higher historical win rate and stronger average returns.
With gold already down around 30% from its peak to the recent low, the potential for a technical recovery appears reasonable. That is especially true given how unpopular this view has proven on social media whenever I have raised it. As a contrarian, I see that as an encouraging signal rather than a reason for caution.
View related analysis:
Gold Futures (GC) Technical Analysis
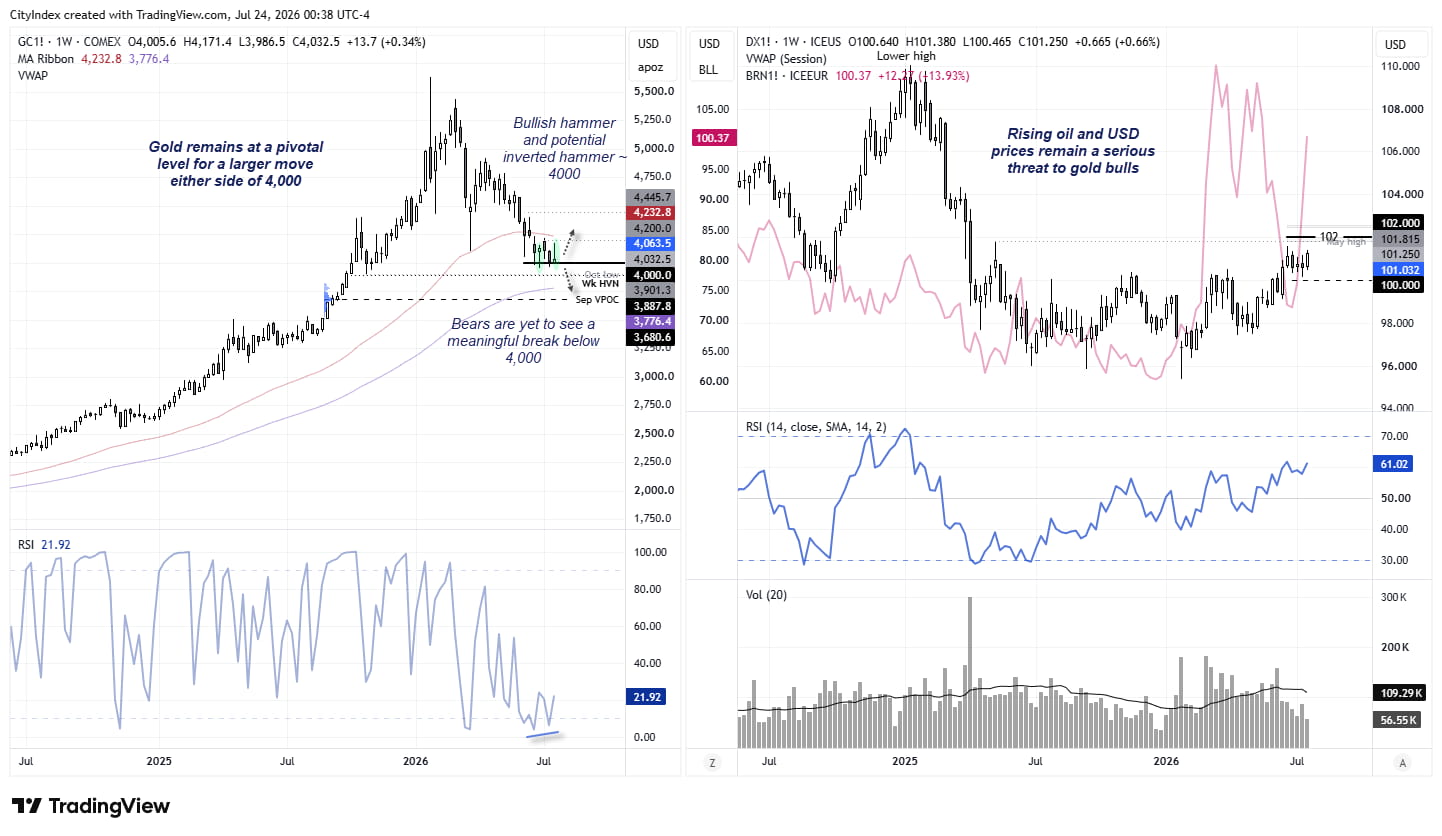
The downtrend on the weekly chart hardly needs pointing out, given gold has fallen by nearly a third this year. Yet for the past four weeks, bears have repeatedly failed to push prices sustainably below 4,000. Weekly trading volumes have also been declining, which is not what we'd typically expect during a grizzly bear market. Meanwhile, the gradual reduction in long futures positions suggests the decline may be a longer-term correction rather than the start of a multi-year top.
A bullish hammer formed three weeks ago, and prices have yet to retest its low. Heading into the final sessions of the week, price action is also shaping a potential inverted hammer around the 4,000 level. Until we see a decisive break or daily close beneath the recent swing lows, I remain on guard for a meaningful bounce.

Crude Oil and the US Dollar Remain the Biggest Risks to Gold Bulls
The fly in the ointment is, of course, the stronger US dollar. However, if tensions in the Middle East begin to ease, it could pave the way for a pullback in the US dollar and provide gold with the catalyst for a rebound. That said, I still favour further gains in the US Dollar Index towards 102. If that scenario plays out, gold could first retest its recent swing lows before the anticipated bullish reversal unfolds
The October low around 3900, 100-week EMA (3776.4) and the September VPOC (3680.6) are the next major support levels should gold prices full break down. But if prices can hold above recent swing lows, resistance sits around 4200 and 4300.
Source: COMEX, ICE, TradingView
This content was created by an affiliate of FOREX.com and represents the views and opinions of the author/speakers, not the views and opinions of FOREX.com, StoneX Group Inc., or its subsidiaries. The content has not been independently reviewed by FOREX.com.
Eyes on 4,000 as We Head into the Weekend
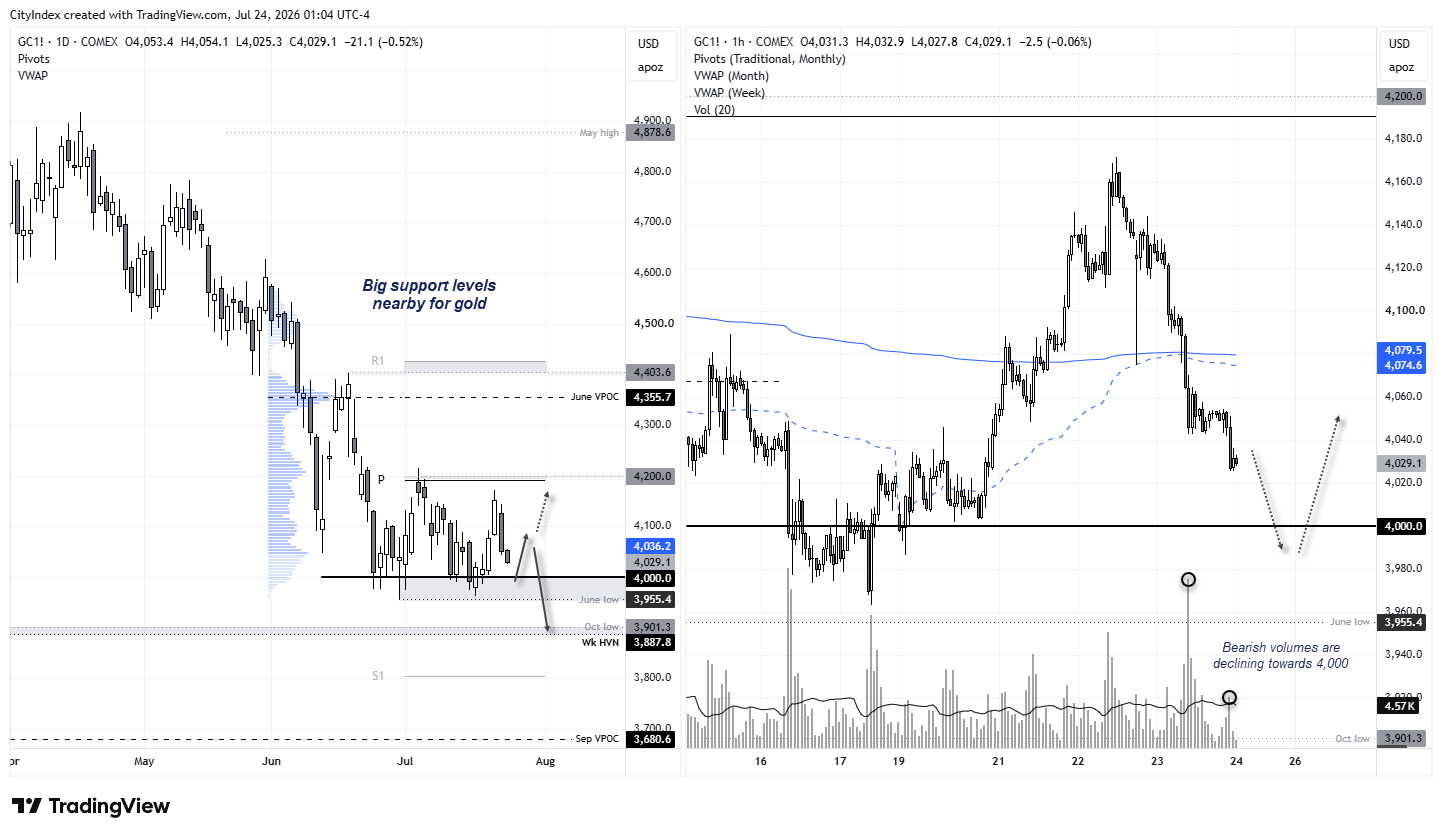
Sentiment is clearly against gold in the near term, after it fell more than 1% on Thursday for its worst daily performance in eight sessions. But the major support level around 4,000 is difficult to ignore. I suspect many traders will feel the same way, which could be compounded by portfolio managers looking to hedge with gold ahead of the weekend.
The risk of a gap higher in oil prices is genuine this weekend, which could of course weigh on sentiment on Monday. But if portfolio managers do use gold as a hedge, it may hold above recent lows to some degree—or at least attempt to.
From a purely technical perspective, dips towards 4,000 could prompt at least a minor rebound. However, for any bounce to have real legs, weaker crude oil prices and a softer US dollar are likely to be required.
Source: COMEX, TradingView
View the full economic calendar
-- Written by Matt Simpson
Follow Matt on Twitter @cLeverEdge
How to trade with City Index
You can trade with City Index by following these four easy steps:
- Open an account, or log in if you’re already a customer
• Open an account in the UK
• Open an account in Australia
• Open an account in Singapore
- Search for the market you want to trade in our award-winning platform
- Choose your position and size, and your stop and limit levels
- Place the trade







Web Trader platform
Our sophisticated web-based platform is packed with features.
Open an account today
Experience award-winning platforms with fast and secure execution.
Economic calendar
Related articles

Gold and S&P 500 analysis: What now after Warsh’s hawkish speech?
The dollar surged across the board after the Fed Chair Kevin Warsh surprised with a hawkish-leaning speech at the Jackson Hole summit. All the bearish dollar bets that had been accumulated since last Friday on the back of data weakness and bond market troubles had to be squared and that triggered a short squeeze rally for the dollar. Gold and silver dropped, as a result, as too did bitcoin, while US indices were giving back earlier gains.


AUD/CAD breakout puts the Bradman barrier in sight
A bullish breakout has pushed AUD/CAD to its highest level since early 2021. Whether it can clear 0.9994 may determine if the move extends well above parity.


Gold Pullback Risk Builds as AUD/USD and USD/CAD Set Up
Gold has stalled near major resistance after a powerful rally, while AUD/USD looks stretched and USD/CAD attempts to extend its rebound.