

US Dollar Price Action Setups: EUR/USD, GBP/USD, AUD/USD, USD/JPY
The US Dollar set a fresh lower-low and then stalled as rate markets continue to harbor the expectation that the Fed will hike later this year. But if looking at this through USD/JPY, the matter gets a bit more complicated.
Written by
James Stanley
Sr. Strategist
US Dollar Talking Points:
- The US Dollar set a fresh lower-low this week after the increased Treasury buyback announcement on Wednesday.
- After that, the move stalled, as did the breakout in EUR/USD even though GBP/USD and AUD/USD saw their breakouts accelerate.
- USD/JPY remains the big item as the carry trade is a crowded position. But with negative carry on short positions the cost of holding counter-trend, against the grain of fundamentals, can be a painful endeavor until greater evidence shows that a shift may be nearing.
USD/JPY bulls continue to bid dips and we saw that again after the surprise announcement of increased Treasury buybacks. And while the Japanese Yen is just 13.6% of the DXY basket, given that the USD/JPY pair is still more than 50% above the early-2021 level there’s still the illustration of a crowded long trade.
We’ve seen multiple episodes of unwind since then, in November of 2022 and 2023 and again in July of 2024. Each of those events triggered from the prospect of change given softening US inflation, which has not really been an item to entertain of late given last months 3.4% headline CPI print. That is, of course, something that could change, but, for now, we have the simple action of dual intervention drawing a theoretical line in the sand, which complicates bullish continuation strategies in USD/JPY and, in-turn, the USD.
On the Dollar chart, there’s a couple spots of possible resistance such as the Fibonacci level around the 99 handle, the prior swing at 99.18 and then the 99.50 level that was helping to hold the lows until the breakdown move on Wednesday.
US Dollar Daily Chart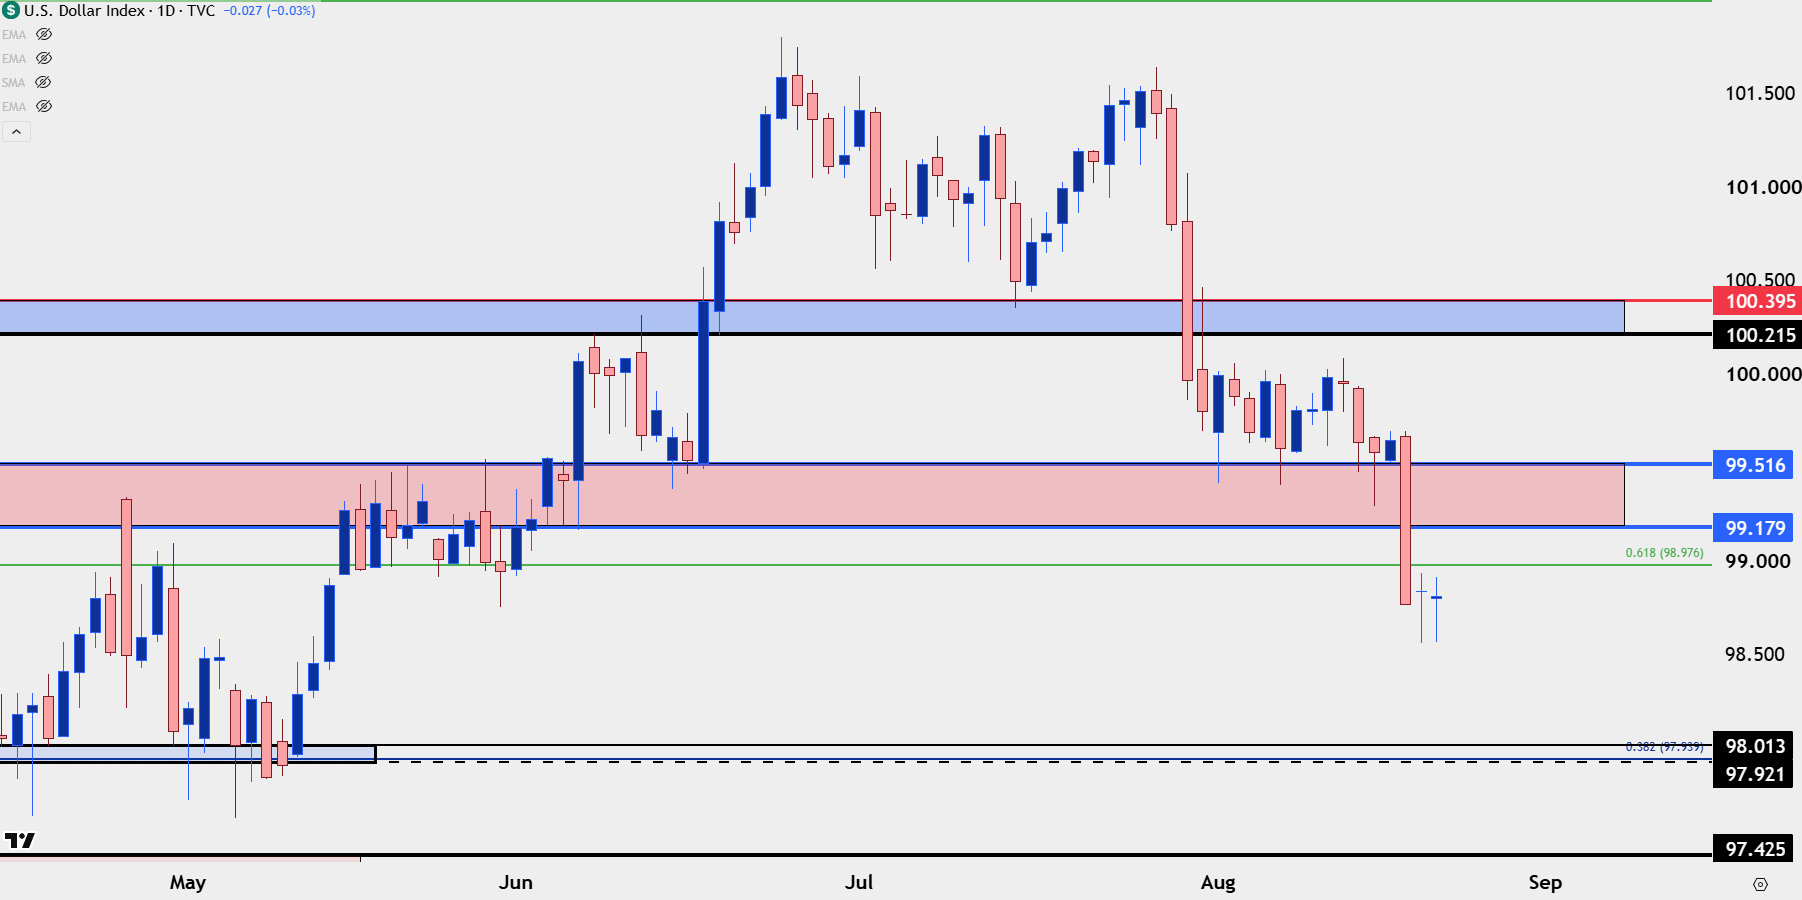
Chart prepared by James Stanley; data derived from Tradingview
USD/JPY
USD/JPY on pullbacks can still be attractive, largely due to the carry behind the trade along with the continued fundamental divergence, where inflation is high in the US and above the Fed’s target while inflation in Japan remains below the BoJ’s 2% target.
This fundamental impact is so profound that even circulating rumors of a BoJ rate hike in September – even with inflation below 2% - failed to excite USD/JPY bears.
To be sure the trade still does exhibit symptoms of crowding and when we do get shocks such as the Wednesday announcement from the Treasury department, selling triggers stops on longs which leads to quick and violent moves lower. But so far, that’s simply been followed by bulls coming in to bid dips at support.
The challenge here is for longer-term USD scenarios. For USD-strength to play out, then logically, we would probably need to see USD/JPY above 160 and perhaps even higher. And this would imply either failure or a change in behavior from the BoJ and the US Treasury Department. For USD/JPY levels, this week it was the 158.08 level that was defended vigorously and as you can see from the series of underside sicks, bulls have been quite responsive to intra-day pullbacks in the pair.
USD/JPY Daily Price Chart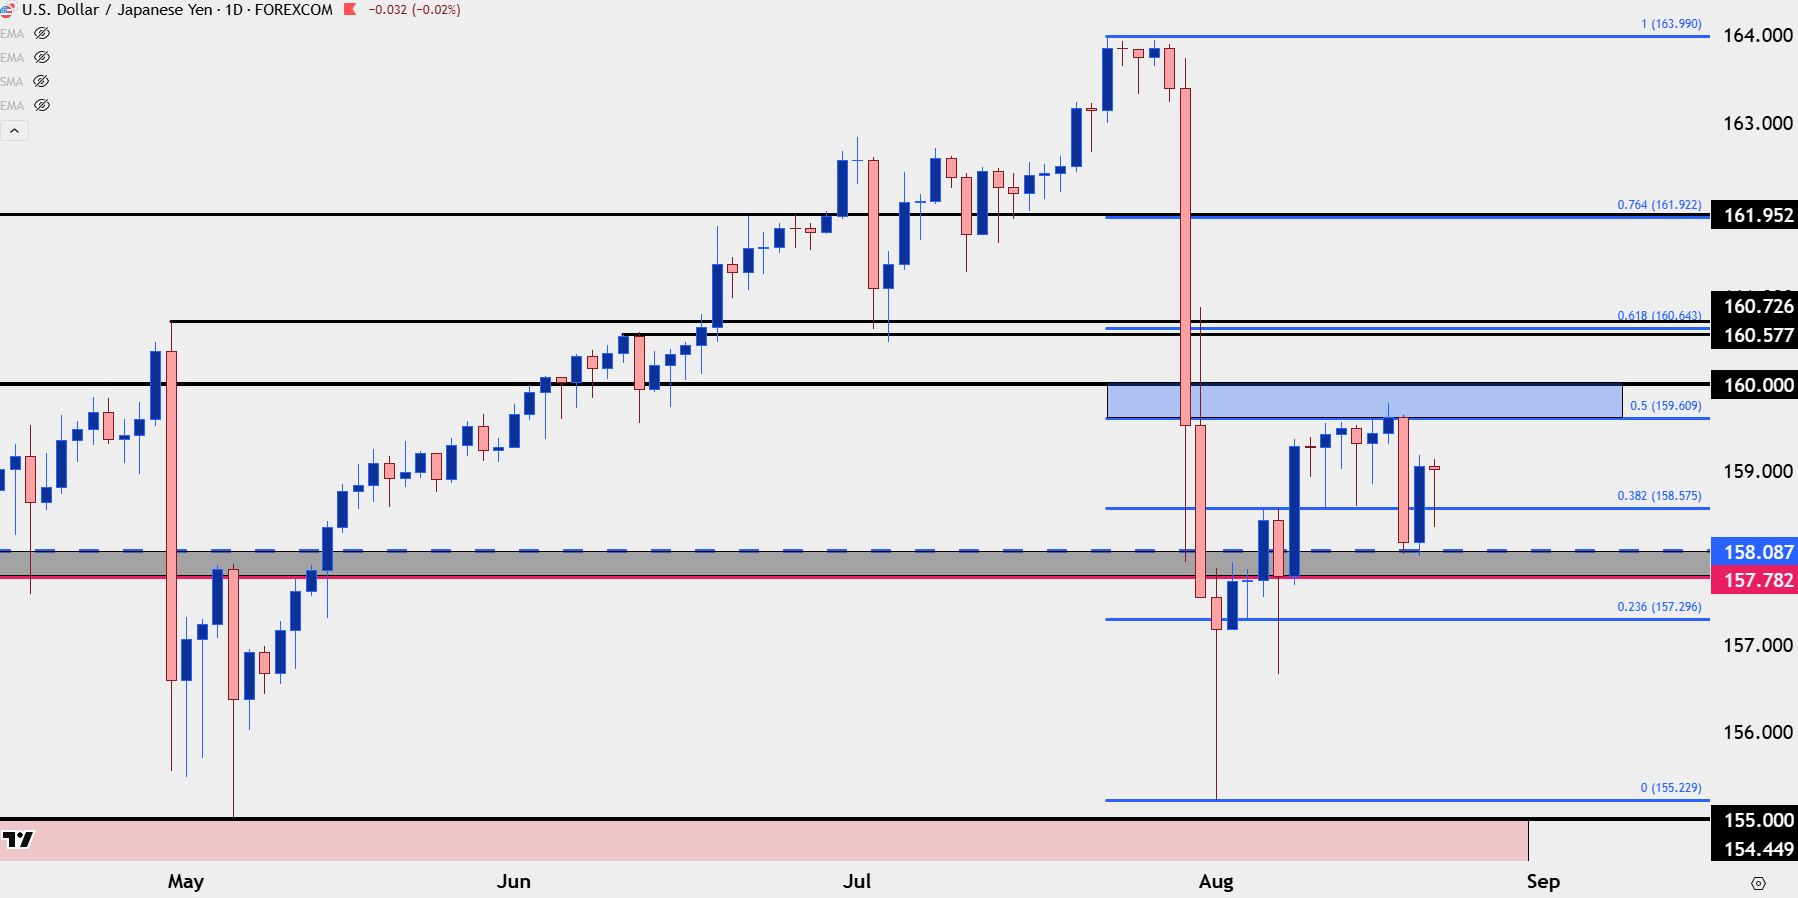
Chart prepared by James Stanley; data derived from Tradingview
EUR/USD
EUR/USD has put in clean continuation ever since the FOMC breakout from the falling wedge in late-July. The pair set a fresh three-month high this week with a test and pause at the 1.1700 handle but, so far, there’s been short-term support at 1.1669 which is the bottom side of a resistance zone that I’ve been tracking.
For support, it’s now that prior zone of resistance that stands out from 1.1576-1.1613 with both levels of that zone playing a recent role, first as the Monday high and then as the Tuesday low, leading to the massive jump on Wednesday.
EUR/USD Daily Chart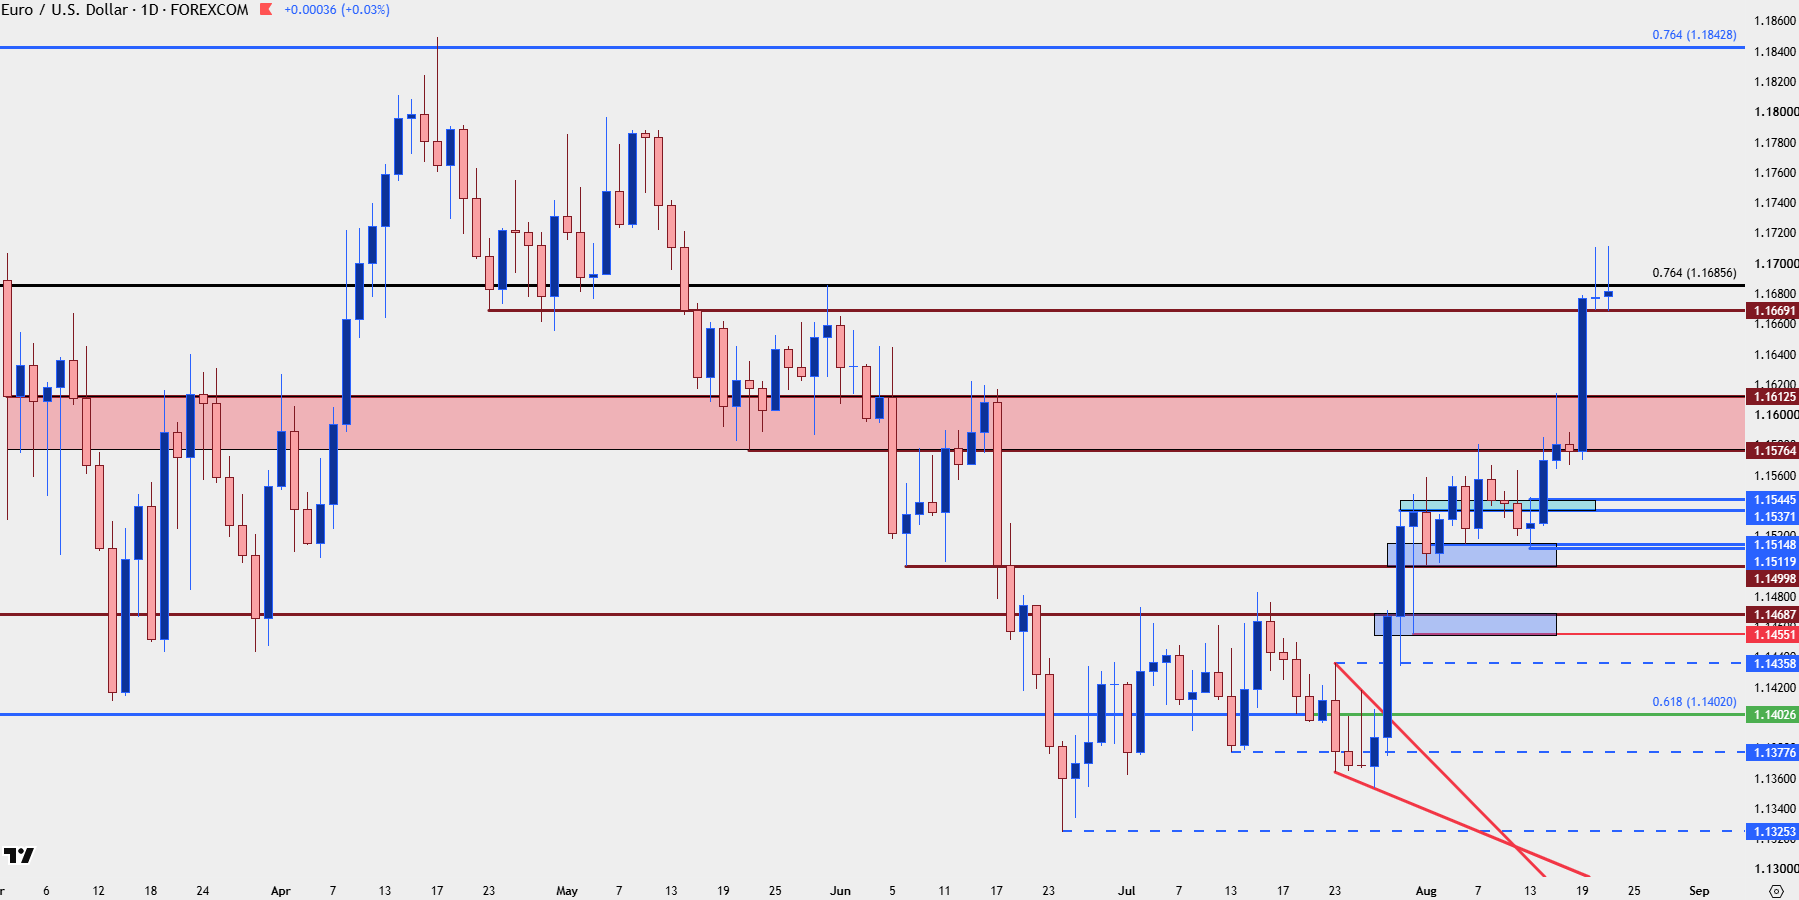
Chart prepared by James Stanley; data derived from Tradingview
GBP/USD
Cable has put in a massive breakout on the back of USD-weakness and unlike the stalling in EUR/USD over the past two days, GBP/USD has continued to jump.
Coming into this week we had an ascending triangle in the pair and as such, I’ve been favoring GBP/USD over EUR/USD. I think there’s still a case to be made there given recent momentum. There’s a spot for short-term support around the 1.3600 handle and even a minor rally in USD/JPY, perhaps to 159.60, could allow for that scenario.
GBP/USD Four-Hour Chart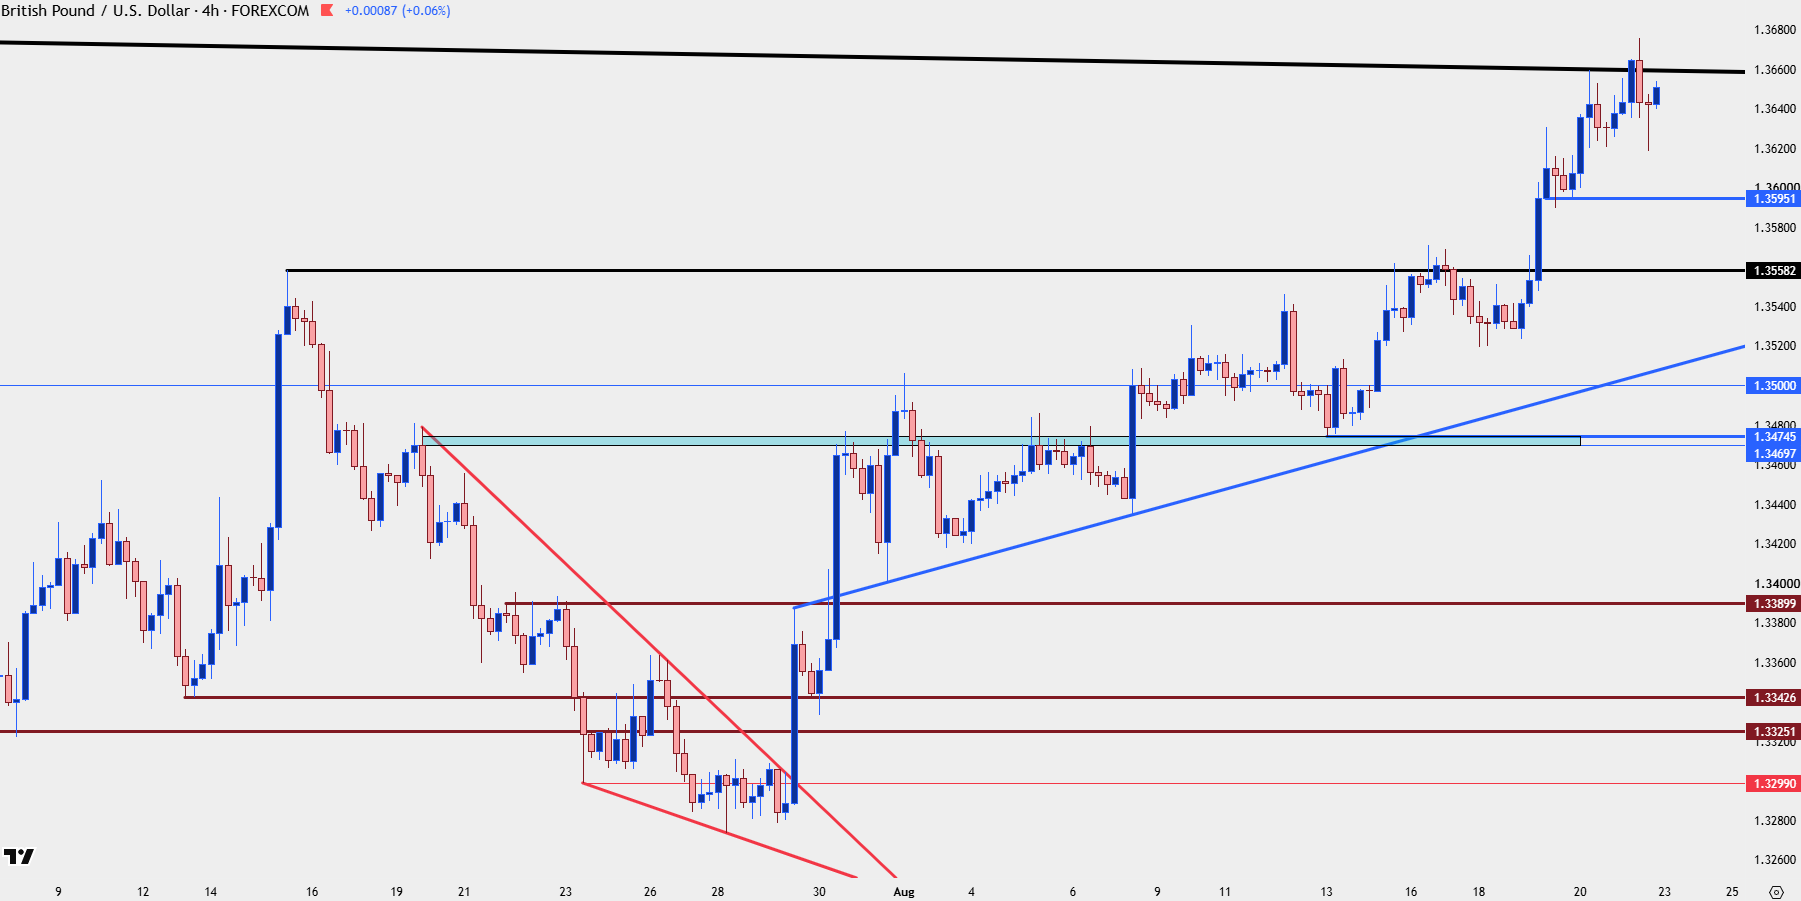
Chart prepared by James Stanley; data derived from Tradingview
AUD/USD
Continuing the comparison amongst majors, AUD/USD has taken on a parabolic tone as it’s running towards the .7200 handle.
I looked at the pair early last week as a setup of interest for USD-weakness scenarios and at the time, it was still working on acceptance above the .7000 big figure.
The pair is now showing overbought on the daily (although that can change as this read is ahead of market close) and that complicates momentum or breakout scenarios. But – given the prior stalling at the .7130 level, there’s an ideal spot to look for bullish defense on pullback scenarios.
AUD/USD Daily Chart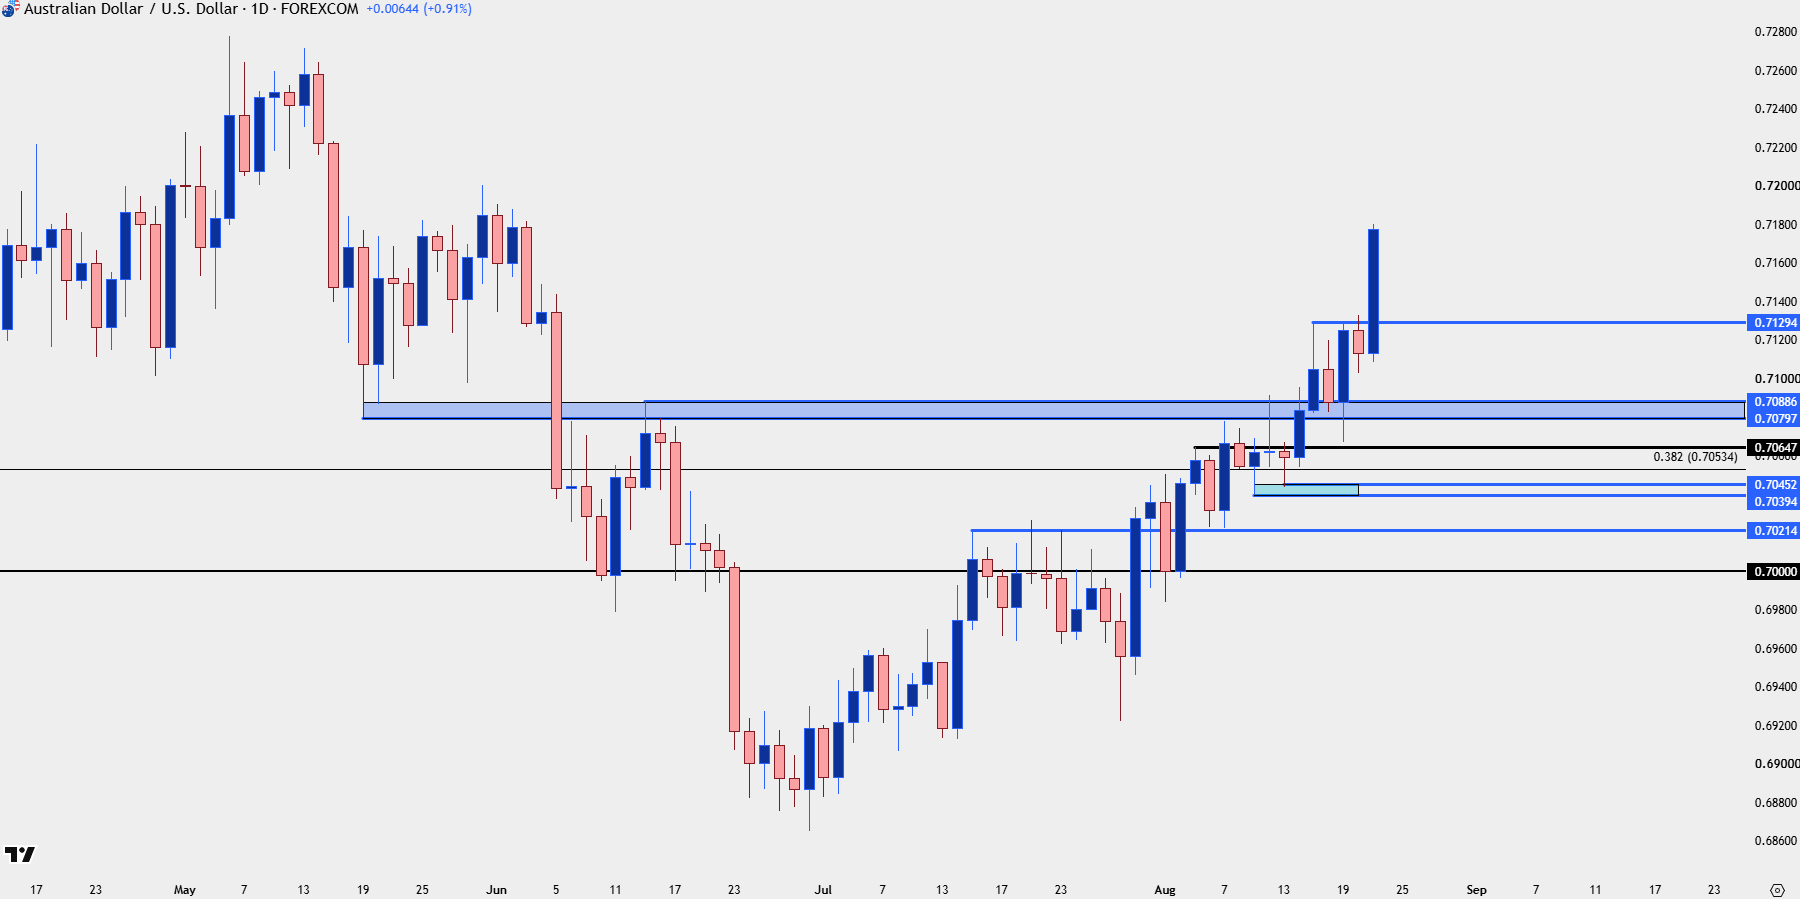
Chart prepared by James Stanley; data derived from Tradingview
--- written by James Stanley, Senior Market Analyst, Global Macro







Web Trader platform
Our sophisticated web-based platform is packed with features.
Open an account today
Experience award-winning platforms with fast and secure execution.
Economic calendar
Related articles

Euro Short-term Outlook: EUR/USD Pullback Nears Pivotal Uptrend Support 8 28 2026
Warsh's comments accelerated the EUR/USD selloff, raising the stakes as buyers look to stabilize the broader recovery.


EUR/USD forecast: All eyes on Warsh at Jackson Hole - Forex Friday
For much of this week, the EUR/USD has been edging lower with the US dollar regaining some ground after last week’s sell-off that was triggered, in part, by the bond market worries. Investors have been unwilling to bet further against the US dollar so far this week ahead of Kevin Warsh’s keynote speech at the Jackson Hole summit, due later today.


AUD/CAD breakout puts the Bradman barrier in sight
A bullish breakout has pushed AUD/CAD to its highest level since early 2021. Whether it can clear 0.9994 may determine if the move extends well above parity.
