


US Dollar Short-term Outlook: USD Correction Pressures Pivotal Support 8 5 2026
The U.S. Dollar's post-FOMC slide has returned the index to a pivotal support zone, where the next move could shape the August outlook. NFPs on tap.
Written by
Michael Boutros
Sr. Technical Strategist
US Dollar Index Technical Outlook: USD Short-term Trade Levels
- The U.S. Dollar has fallen more than 2% from the yearly high after breaking below the May uptrend.
- The recent selloff has returned the index to an important technical inflection zone into the August open with the weekly range set just above.
- Momentum continues to favor the bears, with the current decline unfolding in an orderly technical structure.
- A sustained break below support would increase the case for a broader USD correction.
- This week's Non-Farm Payrolls report could provide the catalyst for the next major directional move. CPI on tap next week.
- DXY Resistance 101.15/35, 100.64/77 (key), 101.59- Support 99.41/49, ~99.17 (key), 98.68/69
The U.S. Dollar enters the first week of August under increasing technical pressure after breaking below the July uptrend and extending its post-FOMC decline. Although the broader yearly advance remains intact, weakening momentum and the loss of trend support have shifted attention to a critical support zone at the weekly low. With Friday's Non-Farm Payrolls report likely to shape expectations for Fed policy, traders will be looking for confirmation on whether this pullback remains a healthy correction or begins to evolve into something more significant. Battle lines drawn on the DXY short-term technical charts.
US Dollar Index Price Chart – USD Daily
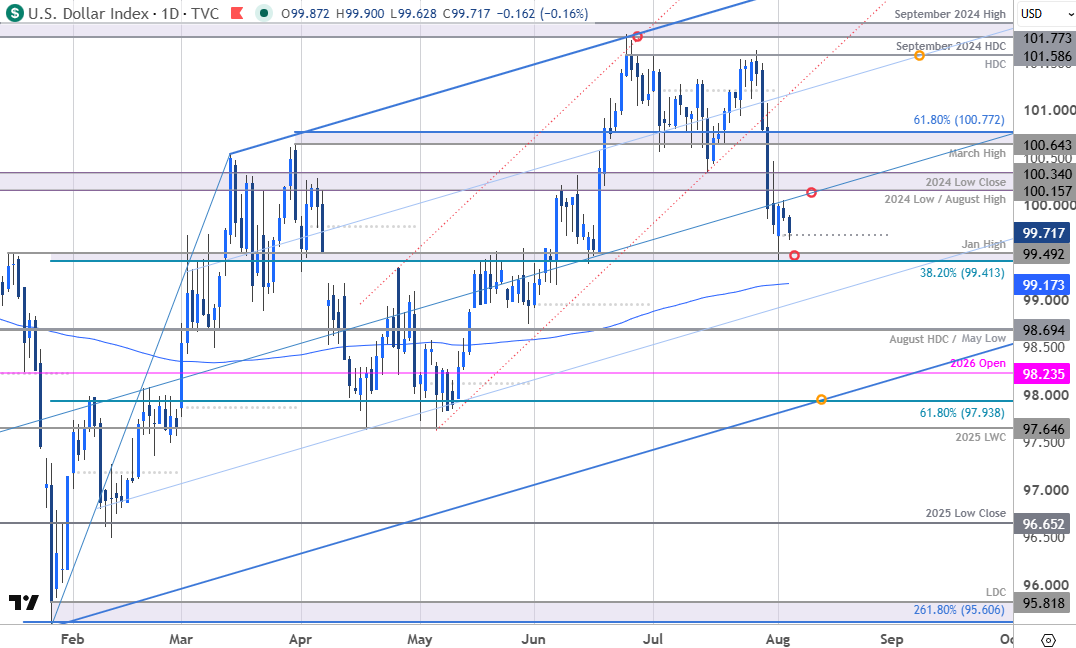
Chart Prepared by Michael Boutros, Sr. Technical Strategist; DXY on TradingView
Technical Outlook: In last month’s US Dollar Short-term Outlook we noted that DXY had carved the July opening range just above support at the May uptrend with, “a close below 100.64 needed to fuel the next leg lower. Look for a larger reaction on drop towards 100.15/35 IF reached. The index broke lower the following day with price registering an intraday low at 100.35 before rebounding. A re-test of the July range high failed with the subsequent reversal finally clearing support into the close of month.
The break takes DXY back below the median-line of the January uptrend with the weekly opening-range now taking shape just below. Daily RSI has now reached the lowest levels since January and the momentum profile continues to favor the bears, for now.
US Dollar Index Price Chart – USD 240min
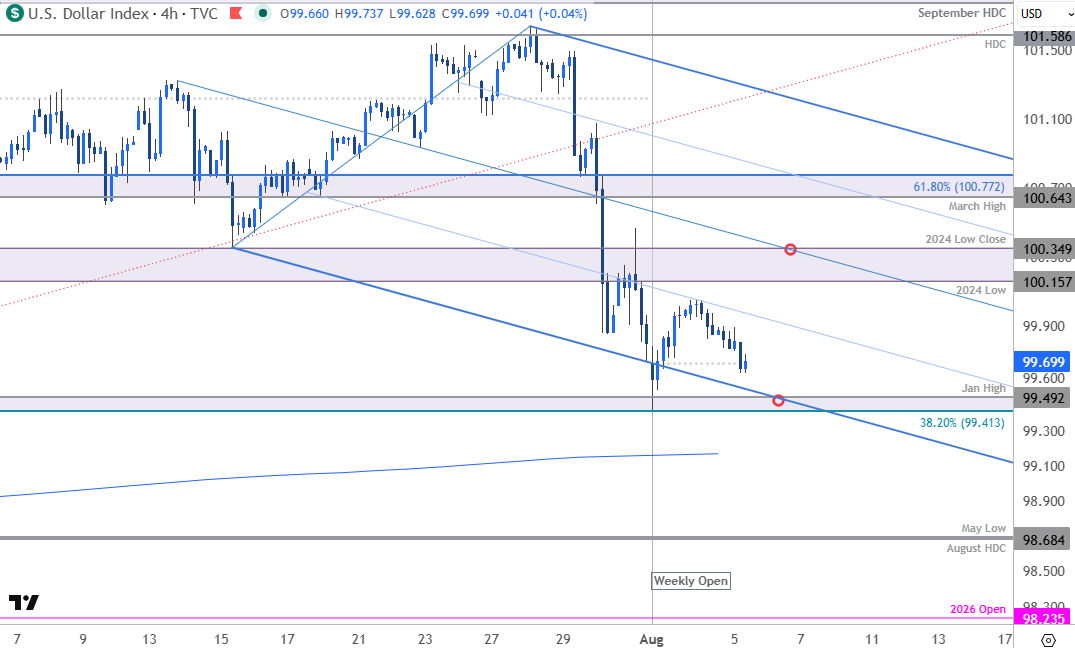
Chart Prepared by Michael Boutros, Sr. Technical Strategist; DXY on TradingView
Notes: A closer look at USD price action shows DXY trading within the confines of a descending pitchfork extending off the July high with the lower parallel highlighting near-term support at the 38.2% retracement of the yearly range and the January swing high at 99.41/49. A break / daily close below this pivot zone would be needed to fuel the next leg lower in price with support objectives lined up just lower at the 200-day moving average near 99.17 and the 2025 May low and the 2025 August high-day close just low 98.68/69. Subsequent support rests at the objective yearly open at 98.24 and the 61.8% retracement of the yearly range at 97.94 – both levels of interest for possible downside exhaustion / price inflection IF reached.
Initial resistance is eyed back at the 2024 low / low-close at 100.15/35 with near-term bearish invalidation now set to the March high and the 61.8% extension of the January rally at 100.64/77. Note that the 75% parallel converges on this threshold over the next few days and a breach / close above this zone would be needed to suggest a more significant low is in place and larger reversal is underway. Ultimately, the bulls would need to clear this formation to mark uptrend resumption with subsequent resistance levels unchanged at the 2026 high-day close (HDC) at 101.59 and the 2024 September high / HDC at 101.77/92.
Bottom line: The U.S. Dollar has plunged more than 2.3% off the yearly high with the index trading just above pivotal support into the start of the month. From a trading standpoint, rallies would need to be limited to 100.77 IF price is heading lower on this stretch with a close below the 200-day moving average needed to fuel the next major leg of the decline. Look for a larger reaction on a stretch towards the yearly open IF reached.
Keep in mind we get the release of the highly anticipated Non-Farm Payrolls report into the close of the week. A resilient labor market would reinforce expectations for a restrictive Fed, while signs of cooling employment could temper rate-hike expectations and drive a repricing across the U.S. dollar, Treasury yields, and broader risk assets. Stay nimble into the event risk and watch the weekly close for confirmation of the prevailing trend. Review my latest US Dollar Weekly Forecast for a closer look at the longer-term DXY technical trade levels.
Key US Economic Data Releases
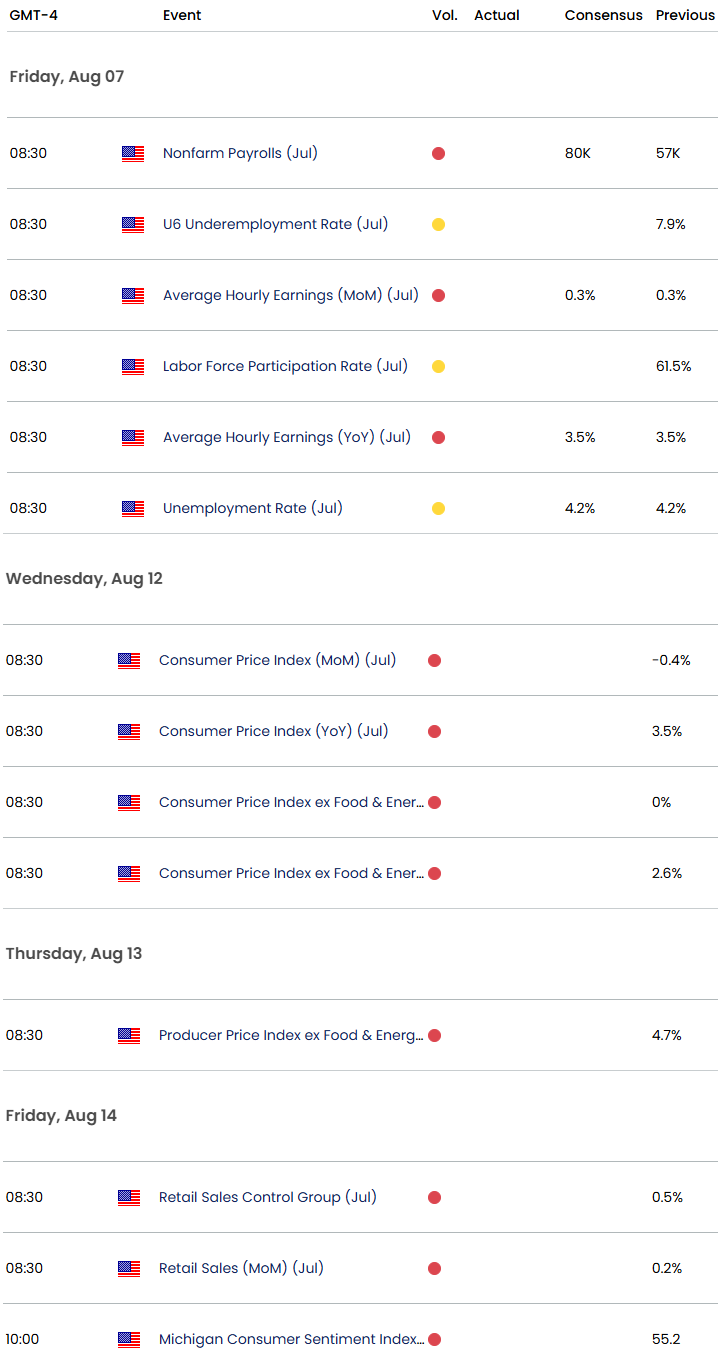
Economic Calendar - latest economic developments and upcoming event risk.
Written by Michael Boutros, Senior Technical Strategist
Follow Michael on X @MBForex







Web Trader platform
Our sophisticated web-based platform is packed with features.
Open an account today
Experience award-winning platforms with fast and secure execution.
Economic calendar
Related articles

Canadian Dollar Forecast: USD/CAD Weekly Reversal Puts Yearly Uptrend Back in Focus 8 29 2026
USD/CAD has staged its strongest weekly advance since June, shifting the focus to whether a more durable low is finally taking shape.

USD/JPY weekly outlook: Payrolls may challenge the Fed’s hawkish reset
USD/JPY has finally woken from its slumber. Payrolls now loom as the key test of whether the latest hawkish repricing sticks or sinks.


Euro Short-term Outlook: EUR/USD Pullback Nears Pivotal Uptrend Support 8 28 2026
Warsh's comments accelerated the EUR/USD selloff, raising the stakes as buyers look to stabilize the broader recovery.