


US Dollar Short-term Outlook: USD Rally Fails at 100 – Bulls Face Decision Point 3 24 2026
The US Dollar has turned lower after failing at 100 and is now testing trend support. The next move may decide whether the rally resumes or fades.
Written by
Michael Boutros
Sr. Technical Strategist
US Dollar Index Technical Outlook: USD Short-term Trade Levels
- DXY reversed lower after failing to sustain gains above the 100-handle, marking a clear rejection from a major resistance cluster.
- The pullback has brought price back toward channel support extending from the January lows, where near-term direction is now in focus.
- A sustained move below this support zone would signal a deeper corrective phase, while a rebound here keeps the broader recovery structure intact.
- DXY Resistance 99.68, 100.16/35 (key), 101.00/14 - Support 98.63/68 (key), 98.24, 97.87
The US Dollar has retreated after running into a key resistance zone near the 100 level, halting the recent advance and shifting focus back to support. The pullback comes after a strong recovery from February lows, leaving price action at a critical inflection point within the broader structure. With the index now approaching trend support from the late-January advance, the market faces a pivotal test. A hold here would keep the recovery intact, while a break lower would suggest that the recent rally has run its course. Battle lines drawn on the USD short-term technical charts.
US Dollar Index Price Chart – USD Daily
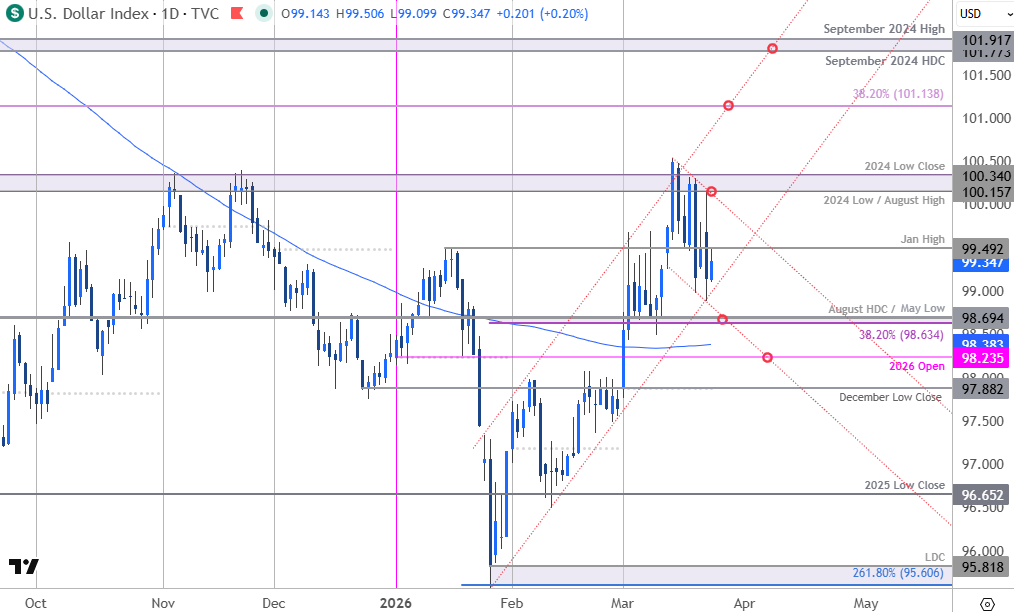
Chart Prepared by Michael Boutros, Sr. Technical Strategist; DXY on TradingView
Technical Outlook: In last month’s US Dollar Short-term Outlook we noted that DXY had, “rallied into pivotal resistance at the January high-close ahead of major event risk tomorrow. From a trading standpoint, losses would need to be limited to 98.24 IF price is heading higher on this stretch with a close above 99.38 needed to fuel the next major leg higher in price.” The index registered an intraday low at 98.49 three-days later before reversing sharply higher with a 2% rally exhausting into confluent resistance last week at 100.15-34- a region defined by the 2024 low, the August high, and the 2024 low-close.
The index has dropped more than 1.6% off the high with price now approaching the channel support extending off the January lows. Its decision time for the bulls at uptrend support and the focus is on a reaction off this slope in the days ahead.
US Dollar Index Price Chart – USD 240min
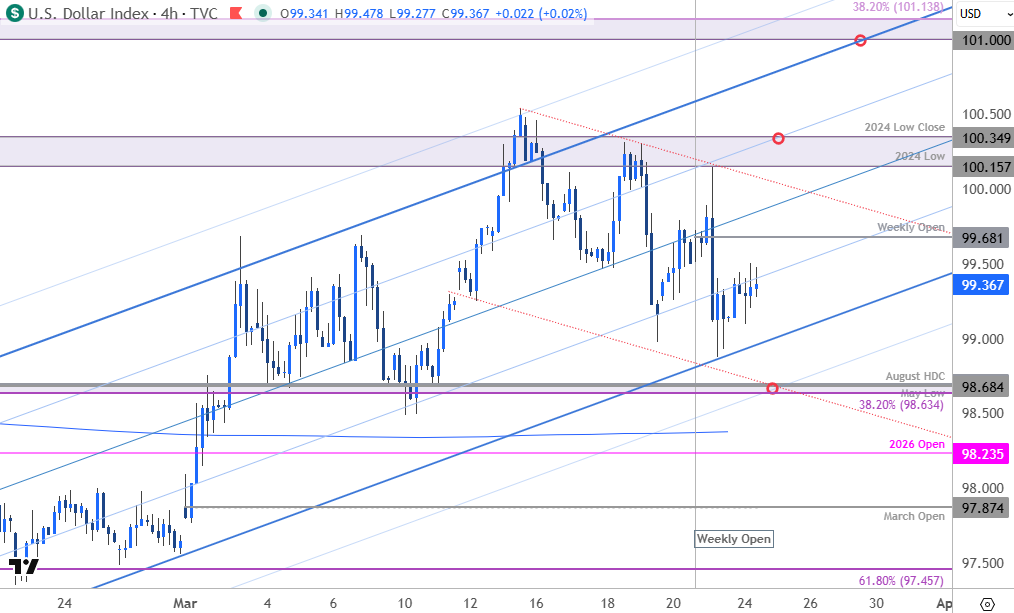
Chart Prepared by Michael Boutros, Sr. Technical Strategist; DXY on TradingView
Notes: A closer look at USD price action shows DXY continuing to trade within the confines of an ascending pitchfork extending off the February low with the lower parallel catching the lows yesterday. Key support rests just lower at 98.63/68- a region defined by the 38.2% retracement of the January advance, the August high-day close (HDC) and the May low. Note that the 1.382% extension of the slope converges on this threshold over the next few days and a break / close below this key pivot zone would suggest a more significant high is in place and a larger reversal is underway. Subsequent support objectives rest with the yearly open at 98.24, backed by the March open at 97.87 and the 61.8% retracement near 97.45. Both these levels represent areas of interest for possible downside exhaustion / price inflection IF reached.
Weekly open resistance stands at 99.68 with a breach / daily close above 100.35 needed to fuel the next major leg of the advance. Subsequent resistance objectives are eyed at the 38.2% retracement of the 2025 decline at 101.00/14 and the September high / HDC at 101.77/92. Look for a larger reaction there IF reached.

Bottom line: The US Dollar index is trading just above pivotal support at the late-January uptrend. From a trading standpoint, losses would need to be limited to 98.63 IF price is heading higher on this stretch with a close above 100.35 needed to mark uptrend resumption.
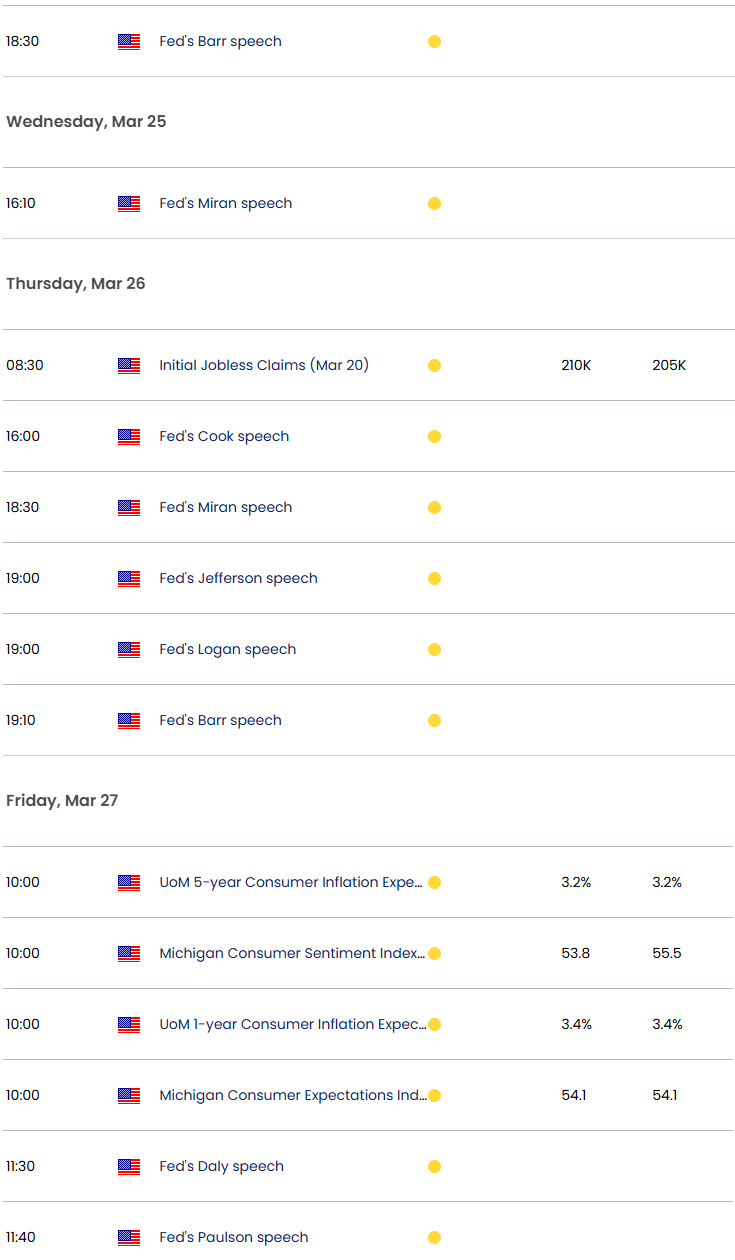
The economic docket is rather light this week but there are a host of Fed speakers on tap. Traders will remain focused on developments out of the Middle East regarding the war in Iran- keep an eye on the headlines and watch the weekly close here for guidance. Review my latest US Dollar Weekly Forecast for a closer look at the longer-term DXY technical trade levels.
Key US Economic Data Releases
Economic Calendar - latest economic developments and upcoming event risk.
Written by Michael Boutros, Senior Technical Strategist
Follow Michael on X @MBForex







Web Trader platform
Our sophisticated web-based platform is packed with features.
Open an account today
Experience award-winning platforms with fast and secure execution.
Economic calendar
Related articles

Canadian Dollar Forecast: USD/CAD Weekly Reversal Puts Yearly Uptrend Back in Focus 8 29 2026
USD/CAD has staged its strongest weekly advance since June, shifting the focus to whether a more durable low is finally taking shape.

USD/JPY weekly outlook: Payrolls may challenge the Fed’s hawkish reset
USD/JPY has finally woken from its slumber. Payrolls now loom as the key test of whether the latest hawkish repricing sticks or sinks.


Euro Short-term Outlook: EUR/USD Pullback Nears Pivotal Uptrend Support 8 28 2026
Warsh's comments accelerated the EUR/USD selloff, raising the stakes as buyers look to stabilize the broader recovery.