


US Dollar, Sterling, Bitcoin Weekly Technical Outlook
Sr. Technical Strategist Michael Boutros highlights the levels that matter on the DXY, GBP/USD and Bitcoin charts this week.
Written by
Michael Boutros
Sr. Technical Strategist
Weekly Technical Trade Levels on DXY, GBP/USD and Bitcoin
US Dollar Index Price Chart – USD 240min
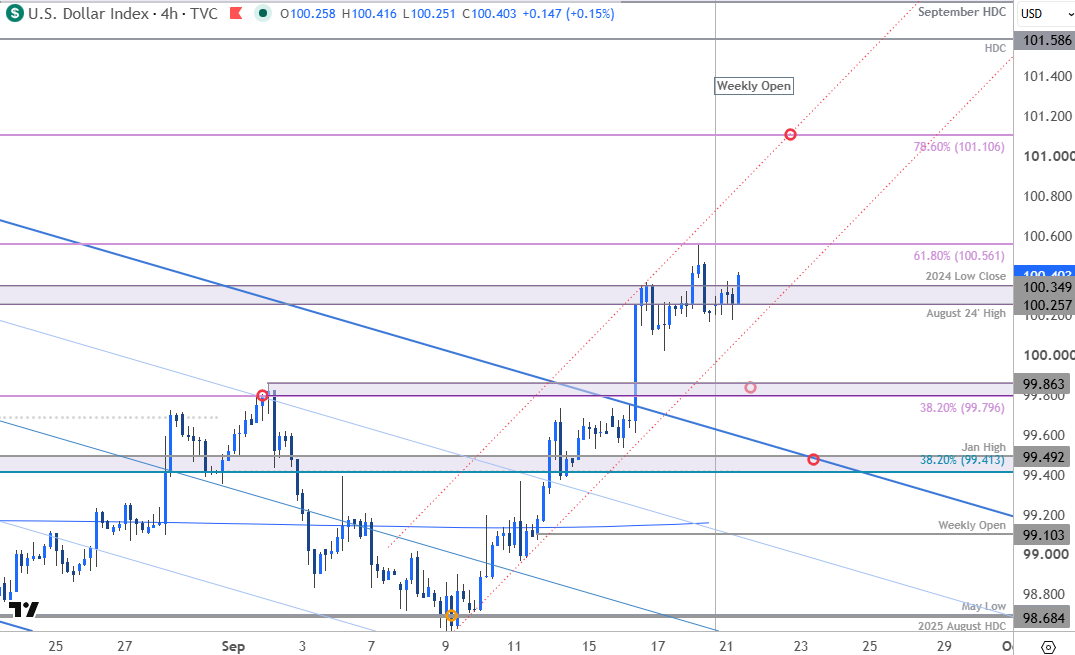
Chart Prepared by Michael Boutros, Sr. Technical Strategist; DXY on TradingView
Notes: The U.S. Dollar Index is testing a key pivot zone at the August 20204 high and the 2024 low close at 100.26/35. The breakout of the September opening range last week keeps the focus on a late-month high, but the rally does need to clear this key zone on a close basis to keep the immediate advance viable in the days ahead.
Initial support rests with the channel line off the monthly low and is backed by 99.80/86- a region defined by the 38.2% retracement of the June decline and the September opening range high. Broader bullish invalidation is now raised to the 38.2% retracement of the yearly range and the January high at 99.41/49.
Initial resistance is eyed at the 61.8% retracement / September high at 100.56. A breach / daily close above this threshold is needed to mark resumption of the monthly uptrend with subsequent resistance objectives eyed at 101.11 and the yearly high-day close at 101.59.
Bottom line: The Dollar rally has extended nearly 2% off the monthly low with the index testing a pivotal resistance near 8-week highs. From a trading standpoint, losses would need to be limited to 99.80 IF price is heading higher on this stretch with a close above 100.56 needed to fuel the next leg higher in the index.
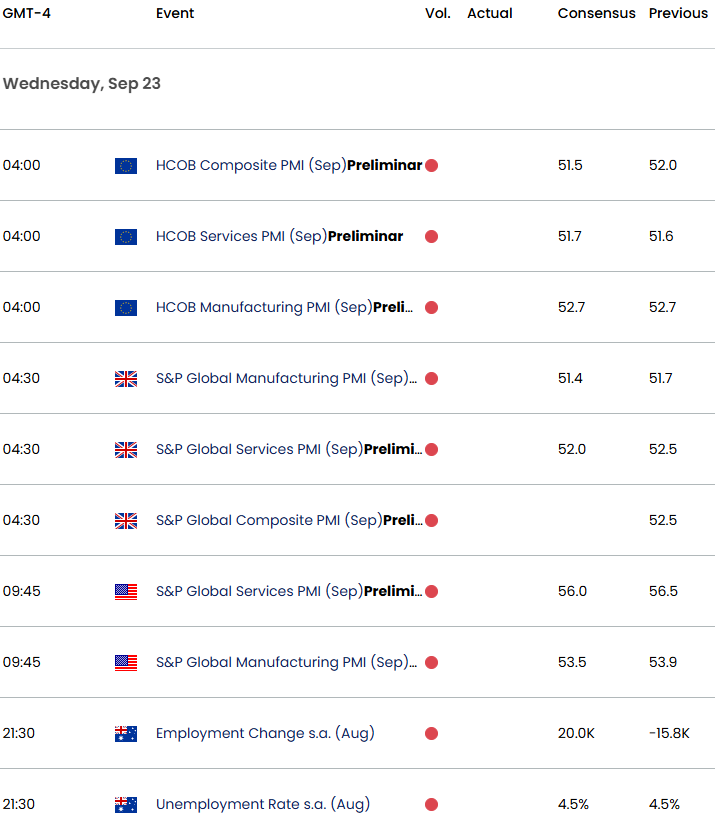
Keep in mind the economic docket is rather light this week with PMI data out of the Eurozone, UK and US highlighting event risk this week. Markets will also be closely watching developments out of Washington, D.C., with President Trump hosting Chinese President Xi Jinping for a state visit on Thursday. Attention will center on any progress—or renewed friction—surrounding trade, tariffs, rare-earth and critical-mineral supply chains, investment, and AI, all of which could have implications for the U.S. dollar and broader risk sentiment.
British Pound Price Chart – GBP/USD 240min
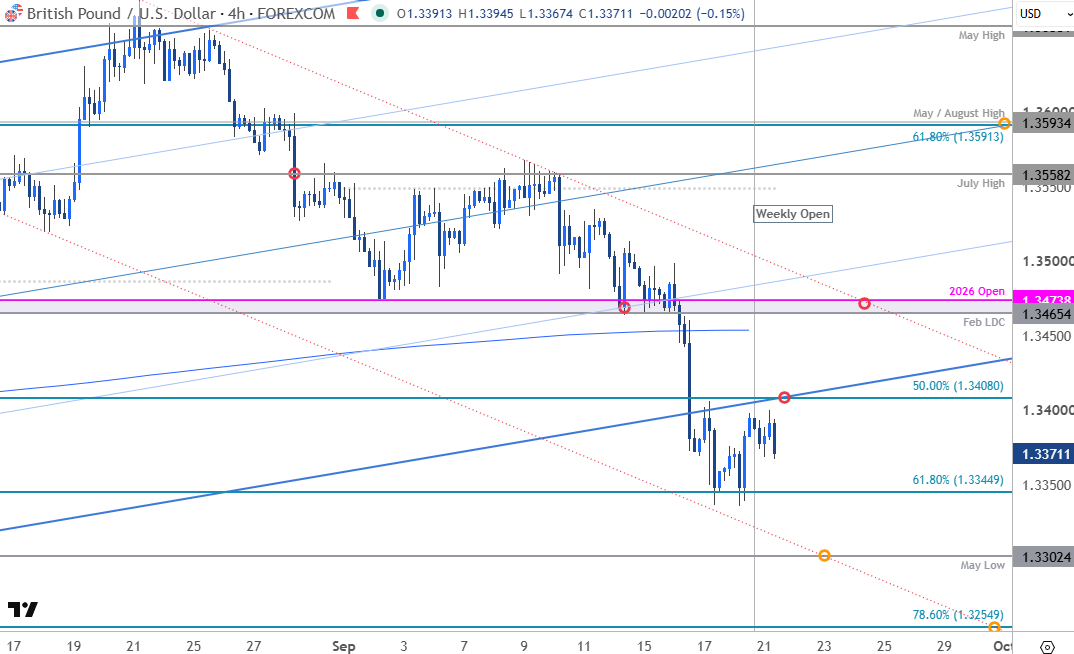
Chart Prepared by Michael Boutros, Sr. Technical Strategist; GBP/USD on TradingView
Notes: Sterling broke below key support last week with the decline rebounding off the 61.8% retracement of the June advance on Friday at 1.3345. Initial resistance is now eyed back at the 50% retracement tat 1.3408 with bearish invalidation now lowered to the February low-day close (LDC) and the yearly open at 1.3465/74.
A break lower from here exposes the May low at 1.3302 backed by the 78.6% retracement at 1.3255. Both levels of interest for possible downside exhaustion / price inflection IF reached.
Bottom line: GBP/USD has broken below multi-month uptrend support with the decline holding a well-defined channel off the August highs. From a trading standpoint, rallies would need to be limited to 1.3474 IF Sterling is heading lower on this stretch with a close below 1.3345 needed to fuel the next leg of the decline.
Bitcoin Price Chart – BTC/USD Daily
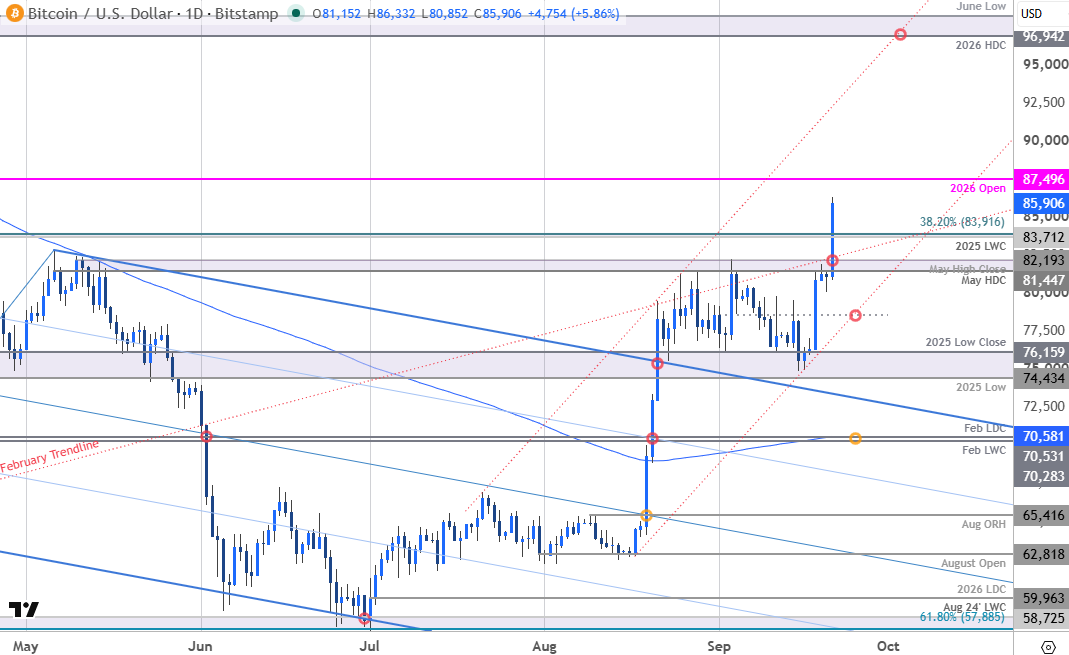
Chart Prepared by Michael Boutros, Sr. Technical Strategist; BTC/USD on TradingView
Notes: Bitcoin broke through the September opening range highs today with BTC/USD extending to the highest levels since January. Weekly momentum has now stretched to a twelve-month high with daily RSI breaking into overbought conditions near 73.
Initial resistance objectives are now eyed at the yearly open near 87,496 with the next major technical consideration eyed at the 2026 high-day close (HDC) and the 2025 June lows at 96,942-98,240. Look for a larger reaction there IF reached.
Initial support now rests back at the 2025 low-week close (LWC) and the 38.2% retracement of the decline off the record highs at 83,712/916 and is backed by the May high / high-day close at 81,447-82,193. The technical outlook remains tilted to the topside while above this threshold with broader bullish invalidation now raised to the objective monthly open at 78,571. Note that the August trendline converges on this zone over the next few days and losses below this slope would be needed to suggest a more significant high is in place and a larger trend reversal is underway.
Bottom line: The focus is the weekly close with respect to 83,916. From a trading standpoint, losses would need to be limited to 81,447 IF Bitcoin is heading higher on this stretch with a close above 87,496 needed to fuel the next major leg of the advance.
Economic Calendar – Key Data Releases
--- Written by Michael Boutros, Senior Technical Strategist
Follow Michael on X @MBForex
Latest market news











Web Trader platform
Our sophisticated web-based platform is packed with features.
Open an account today
Experience award-winning platforms with fast and secure execution.
Economic calendar
Related articles

FX Futures Positioning: Dollar Rebound Meets Diverging Forex Bets | COT Report
US dollar longs held firm into Jackson Hole, while euro, yen and commodity FX positioning diverged ahead of ISM and NFP.


Nasdaq 100 Forecast: NDX slips ahead of Fed Chair Warsh’s speech
U.S. stocks are edging lower on Friday, giving back some of yesterday's gains after Nvidia's strong outlook revived the tech trade. The focus has now shifted firmly to Fed Chair Kevin Warsh's Jackson Hole speech, with investors looking for more clarity on the outlook for interest rates.


EUR/USD forecast: All eyes on Warsh at Jackson Hole - Forex Friday
For much of this week, the EUR/USD has been edging lower with the US dollar regaining some ground after last week’s sell-off that was triggered, in part, by the bond market worries. Investors have been unwilling to bet further against the US dollar so far this week ahead of Kevin Warsh’s keynote speech at the Jackson Hole summit, due later today.
