


Gold, silver shrug off a brutal macro stress test
A hawkish Fed, surging short-dated Treasury yields and a firmer dollar failed to deliver the kind of damage usually seen in precious metals.
Written by
David Scutt
Market Analyst
- US two-year yield surge ranks near 95th percentile since 1976
- Gold, silver Nasdaq correlations rise towards historical extremes
- Gold breaks higher from weeks-long falling wedge structure
- Silver fails at $67.50 after clearing August downtrend
Gold and silver performed remarkably well last week in an environment where historically they would normally struggle, with a hawkish Federal Reserve and sharp rebound in the US dollar not enough to derail them. It begs the question: how would they actually perform in an environment far more palatable than the one they currently face?
A hostile fortnight
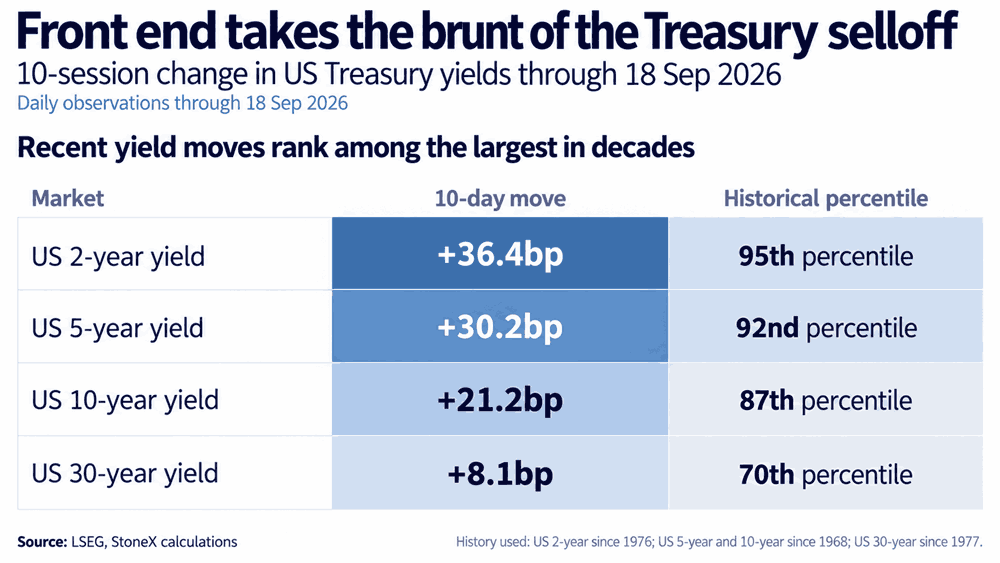
For non-yielding assets that are priced predominantly in US dollars, the resilience was on full display over the past fortnight, with both metals managing to withstand an incredibly large increase in US Treasury yields, particularly at the front end of the curve, either side of the Federal Reserve meeting where it increased rates for the first time in over three years.
Source: LSEG
Over the past 10 sessions, US two-year yields have risen 36.4 basis points, placing the move around the 95th percentile of observations going back to 1976. Five-year yields are up 30.2 basis points, ranking around the 92nd percentile, while 10-year yields have risen 21.2 basis points, around the 87th percentile. Thirty-year yields have increased by a comparatively modest 8.1 basis points, ranking around the 70th percentile.
So while the moves were far from historically unprecedented, they were rare, especially by the standards of recent decades.
Precious metals absorb the hit
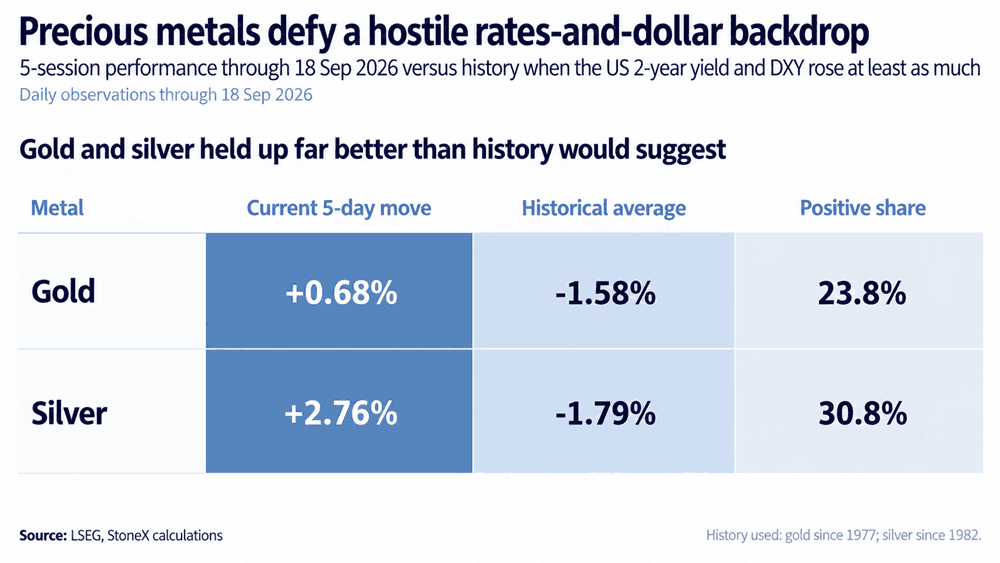
As seen in the graphic below, the performance last week was even more surprising. Over the five sessions to Friday, US two-year yields rose 9.9 basis points while DXY gained 1.11%. Despite those headwinds, gold still managed to rise 0.68%, while silver climbed 2.76%.
Source: LSEG
Looking back at comparable five-session windows where the US two-year yield and DXY increased by at least as much, gold has historically fallen by an average of 1.58%, while silver has declined by an average of 1.79%. Gold has produced a positive return in only 23.8% of those periods, while silver has risen in 30.8%.
Those comparisons are based on a reasonably large historical sample, with 640 comparable five-session windows for gold and 507 for silver, rather than a small number of isolated episodes.
Again, not unprecedented, but it’s not typically how either metal tends to perform in this type of environment.
Macro forces create unusual relationships
Recent heavy focus on the Fed, combined with the influence of high energy prices on Treasury yields, has created an environment where some cross-asset relationships look very different to what would normally be expected. One example is the current relationship between gold, silver and Nasdaq futures.
Gold’s 10-day correlation with Nasdaq futures has risen to around +0.79, placing it near the 98th percentile historically, while silver’s 20-day correlation sits around +0.75, near the 99th percentile.
That probably says more about the dominance of the current macro environment than any fundamental link between precious metals and technology stocks. While the relationship may not remain this strong, it provides traders with a useful sense check when assessing directional setups in the precious metals complex.
Gold bulls force the break
Source: TradingView
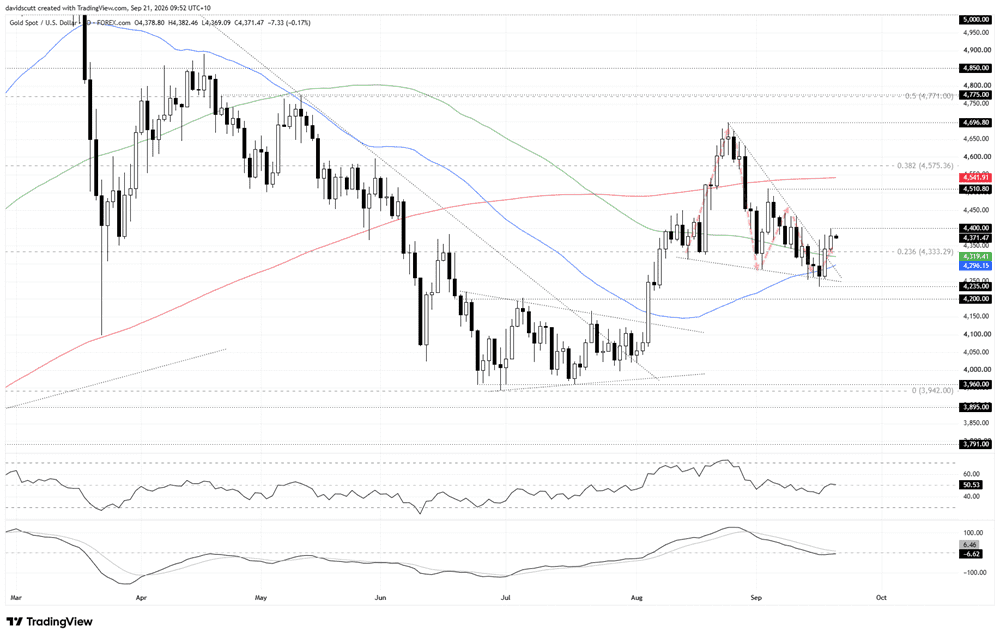
Gold finally delivered the topside break I had forewarned about last week, with the coiling price action inside the falling wedge structure warning of the potential for a move higher, although confirmation was obviously key given it had not happened yet.
That finally occurred on Thursday, probably against the odds after another failed break attempt beneath the lower end of the structure, before follow-through buying on Friday pushed gold up to $4,400 an ounce before reversing into the close.
Given the breakout from the structure and the coiling price action seen for weeks beforehand, it suggests we could now see a resumption of the prior bullish move despite still-tough macro conditions.
$4,400 is the immediate focus overhead. Beyond that, $4,510.80, the high set on September 3, comes into view, followed by the 200-day moving average around $4,542 and the 38.2% Fibonacci retracement of the January to June bear move around $4,575. Above there, focus would shift towards a potential retest of $4,696.80, the high set on August 25 and the ultimate target for the falling wedge breakout.
The message from the oscillators is more neutral at this stage, although with RSI (14) now marginally back above 50 and MACD coiling back towards the signal line and on the cusp of flipping positive, there is evidence momentum may be starting to swing to the topside. That would enhance the prospects for a full extension of the breakout towards the ultimate target.
Underneath where the price now trades, the 23.6% Fibonacci retracement of the January to June bear move attracted plenty of bids last week, along with the 100-day and 50-day moving averages. Together, that creates a support zone that could be used for stop placement for those considering longs.
A push beneath the 50-day moving average would start to question the merits of the bullish bias, while a break beneath the September 16 swing low around $4,235 would only add to doubts over whether playing from the long side remains the appropriate stance.
Silver clears August downtrend
Source: TradingView
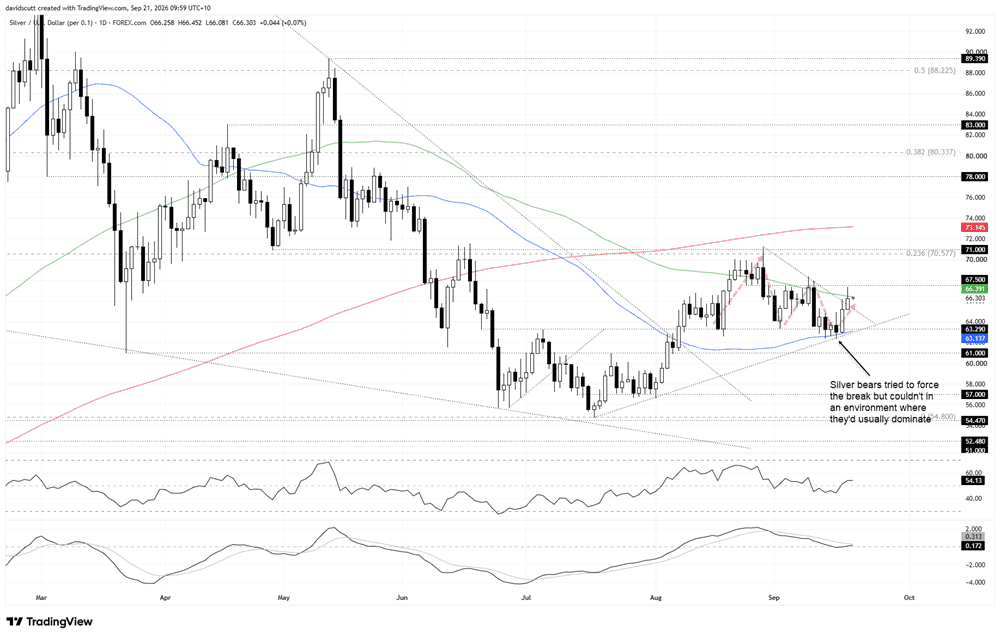
Silver also delivered a breakout last week, pushing above the minor downtrend that had been in place from the August 28 swing high. Before that happened, bears had a decent crack at delivering a meaningful downside break from the descending triangle structure, but failed to make it stick. Given the broader macro backdrop, that failure was probably pretty telling in itself.
The subsequent move higher took the price towards resistance at $67.50 on Friday before reversing to trade back just beneath the 100-day moving average. That is the immediate focal point for traders on the topside.
If $67.50 were to break cleanly, a far tougher resistance zone awaits. The 23.6% Fibonacci retracement of the January to June bear move comes in around $70.58, while $71 has previously acted as support before flipping to resistance. The 200-day moving average is then located just overhead around $73.15.
So while the breakout suggests we could see a push back towards that zone, beyond there may prove to be a much tougher slog in the current environment.
Underneath where the price now trades, there is a confluence of support around $63.29, the rising trendline from the July swing low, and the 50-day moving average, all located in close proximity just beneath $64. That makes the area the immediate focal point on the downside.
If we were to see a reversal of the breakout and a push beneath the recent lows and lower end of that support zone, levels to watch include $61 and then $57, which previously acted as support and resistance for lengthy periods in July.
While RSI (14) continues to set lower highs, the indicator moved back above the neutral 50 level late last week. With MACD also on the cusp of staging a bullish crossover of the signal line, upside momentum may now be starting to build, marginally favouring a bullish bias as we start the new trading week.
Latest market news










Web Trader platform
Our sophisticated web-based platform is packed with features.
Open an account today
Experience award-winning platforms with fast and secure execution.
Economic calendar
Related articles

Gold and S&P 500 analysis: What now after Warsh’s hawkish speech?
The dollar surged across the board after the Fed Chair Kevin Warsh surprised with a hawkish-leaning speech at the Jackson Hole summit. All the bearish dollar bets that had been accumulated since last Friday on the back of data weakness and bond market troubles had to be squared and that triggered a short squeeze rally for the dollar. Gold and silver dropped, as a result, as too did bitcoin, while US indices were giving back earlier gains.


EUR/USD forecast: All eyes on Warsh at Jackson Hole - Forex Friday
For much of this week, the EUR/USD has been edging lower with the US dollar regaining some ground after last week’s sell-off that was triggered, in part, by the bond market worries. Investors have been unwilling to bet further against the US dollar so far this week ahead of Kevin Warsh’s keynote speech at the Jackson Hole summit, due later today.

Bitcoin Forecast: BTC/USD Back to $80K Ahead of Warsh’s Jackson Hole Speech
After surging over $15,000 in the past 10 days alone, there is risk of a near-term pullback if Warsh says anything remotely hawkish at Jackson Hole - what are the levels to watch from here?
