


Crude Oil Weekly Outlook: Saudi–Houthi Escalation vs Key Resistance
Crude Oil Weekly Outlook: Despite escalating Houthi attacks on Saudi Arabia and continuing tensions between the United States and Iran, crude oil prices are now facing major resistance that must be overcome before another bullish rally can be confirmed.
Written by
Razan Hilal
Market Analyst
Despite escalating Houthi attacks on Saudi Arabia and continuing tensions between the United States and Iran, crude oil prices are now facing major resistance that must be overcome before another bullish rally can be confirmed. Houthi attacks on Saudi energy facilities and related injuries have been reported, while the wider U.S.–Iran conflict continues to threaten regional energy infrastructure and shipping routes.
The key resistance levels are:
- Brent (UKOIL): $108: The 7-month trendline that has acted as resistance after serving as support between March and June 2026, combined with the 78.6% Fibonacci retracement of the March–July decline.
- WTI (USOIL): $104.50: The corresponding 7-month trendline and the 78.6% Fibonacci retracement of the March–July downtrend.
Risks of another regional escalation remain elevated, particularly after new travel warnings and security alerts across the Middle East. At the same time, the latest sentiment peak may also signal a potential reversal. This suggests that markets could be shifting from pricing an imminent supply shock toward a prolonged but potentially manageable conflict.
Traders are increasingly focused on whether political and economic pressures, particularly ahead of the U.S. midterm elections, will encourage all sides to avoid actions that could trigger another major spike in energy prices.
Political and regional developments may become increasingly important as the Israeli and U.S. elections approach. Israel’s national election is scheduled for October 27, while the U.S. midterm elections are scheduled for November 3.
Trump has also said that the Iran conflict could end later this year, potentially after the U.S. midterm elections, and that oil prices could fall sharply once the war ends. These claims remain part of the political narrative rather than a confirmed resolution.
A sustained break above $108 for Brent and $104.50 for WTI, combined with a sustained hold in the energy sector ETF above its 18-year resistance, would likely confirm another bullish surge and place renewed pressure on risk appetite.
WTI Weekly Outlook — Log Scale
Source: TradingView
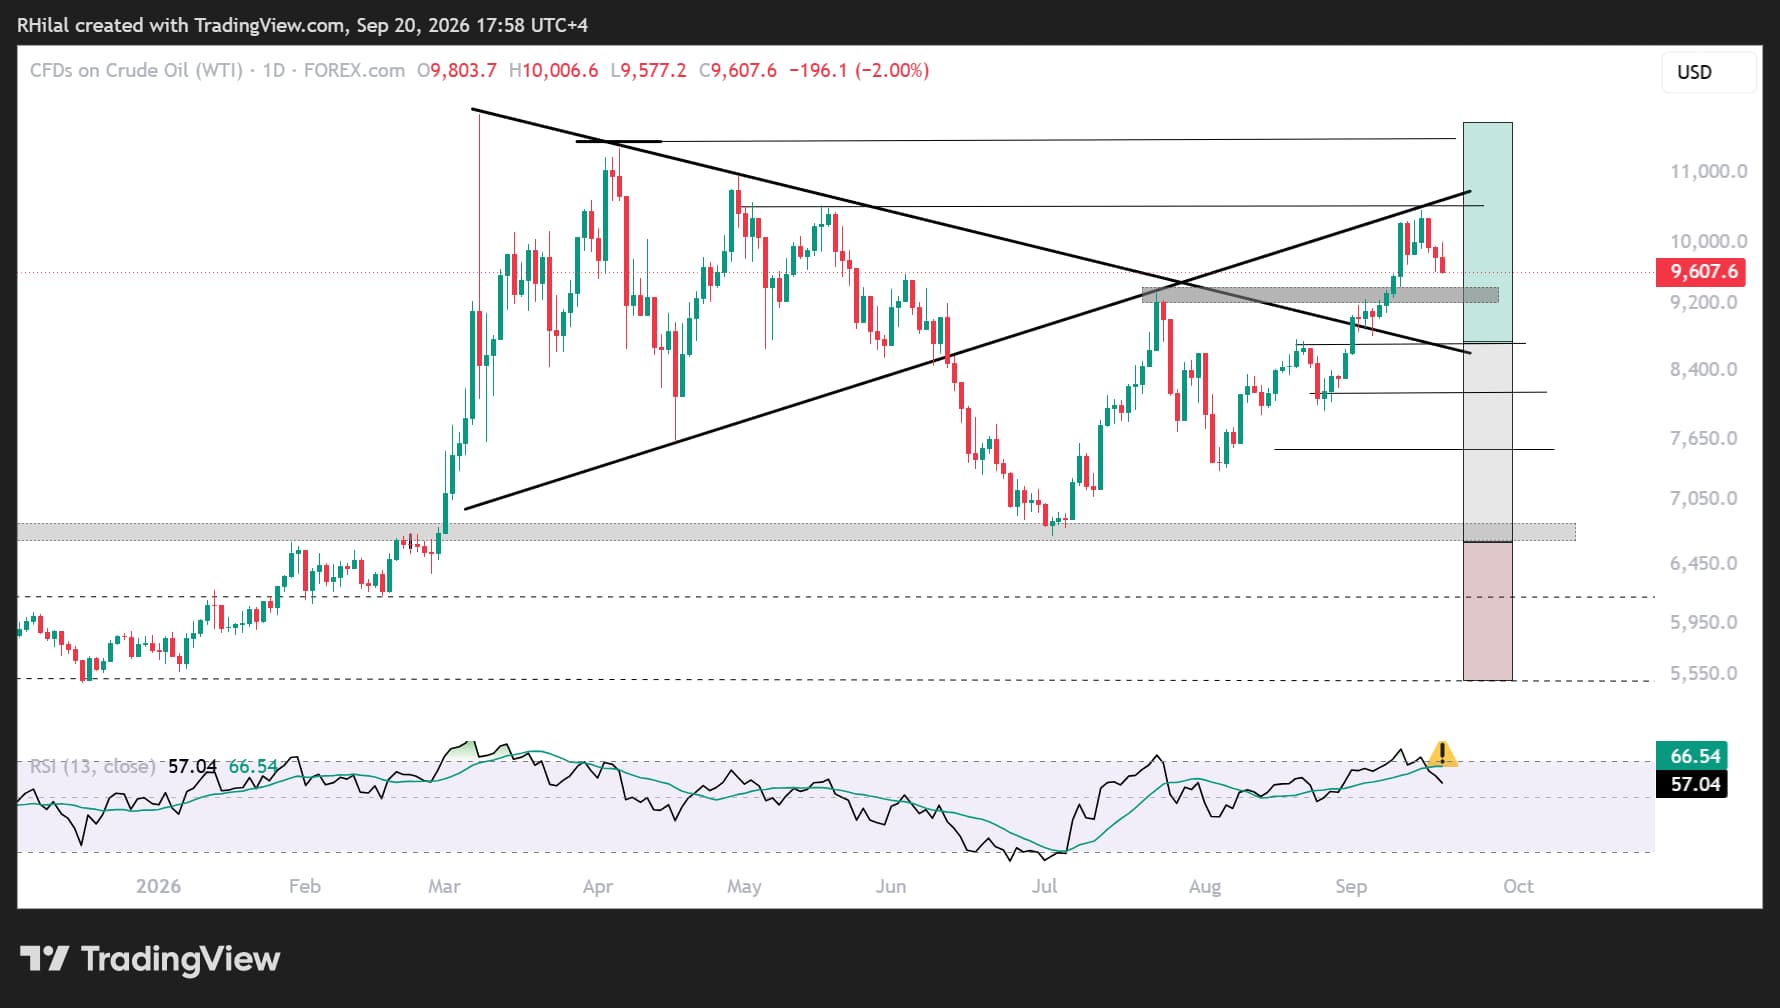
WTI price action has reached a major confluence zone, increasing the possibility that a short-term top may have formed.
The confluence zone includes:
- The 7-month trendline that served as support between March and June 2026 before turning into resistance between July and September 2026.
- The 78.6% Fibonacci retracement of the March–July 2026 downtrend near $104.50.
- Overbought momentum conditions last seen in March, close to the yearly highs.
The pullback was expected given the steepness of the rally and the importance of this confluence zone.
Bullish scenario: Reclaiming the $105 mark would restore the longer-term bullish outlook and reinforce inflationary and geopolitical escalation risks.
Such a move could redirect WTI toward the yearly highs.
Bearish scenario: A move back below the July 2026 high near $94 would support a short-term de-escalation narrative.
The next downside levels would be $92 and $86, corresponding to Fibonacci retracement levels of the advance between August 26 and September 11.
Brent Weekly Outlook — Log Scale
Source: TradingView
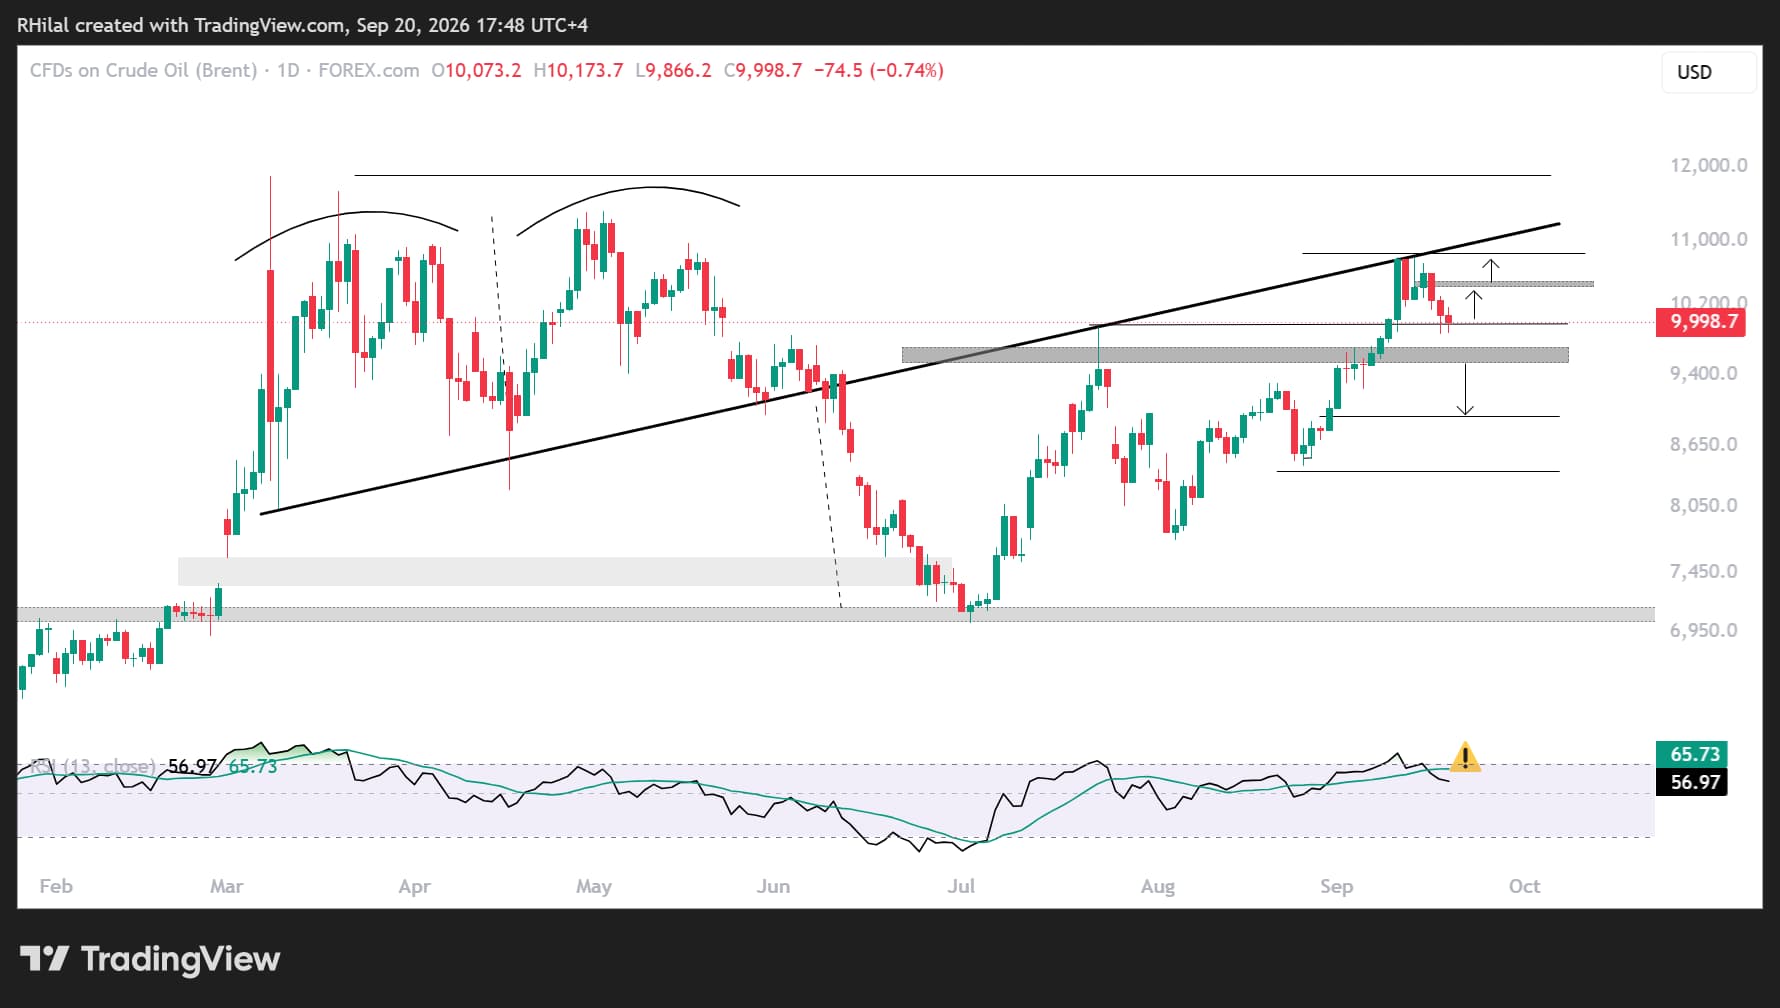
Similar to WTI, Brent crude has reached a major confluence zone, increasing the possibility that a short-term top may have formed.
The confluence zone includes:
- The 7-month trendline that served as support between March and June 2026 before turning into resistance between July and September 2026.
- The 78.6% Fibonacci retracement of the March–July 2026 downtrend near $108.
- Overbought momentum conditions last seen in March, close to the yearly highs.
The pullback was expected given the steepness of the rally and the importance of this confluence zone.
Bullish scenario: Reclaiming the $108 mark would restore the longer-term bullish outlook and reinforce inflationary and geopolitical escalation risks.
Such a move could redirect Brent toward the yearly highs.
Bearish scenario: A move back below the July 2026 high near $99 would support a short-term de-escalation narrative.
The next downside levels would be $95.70 and $93, corresponding to Fibonacci retracement levels of the advance between August 26 and September 11.
XLE Monthly Outlook — Log Scale
Source: TradingView
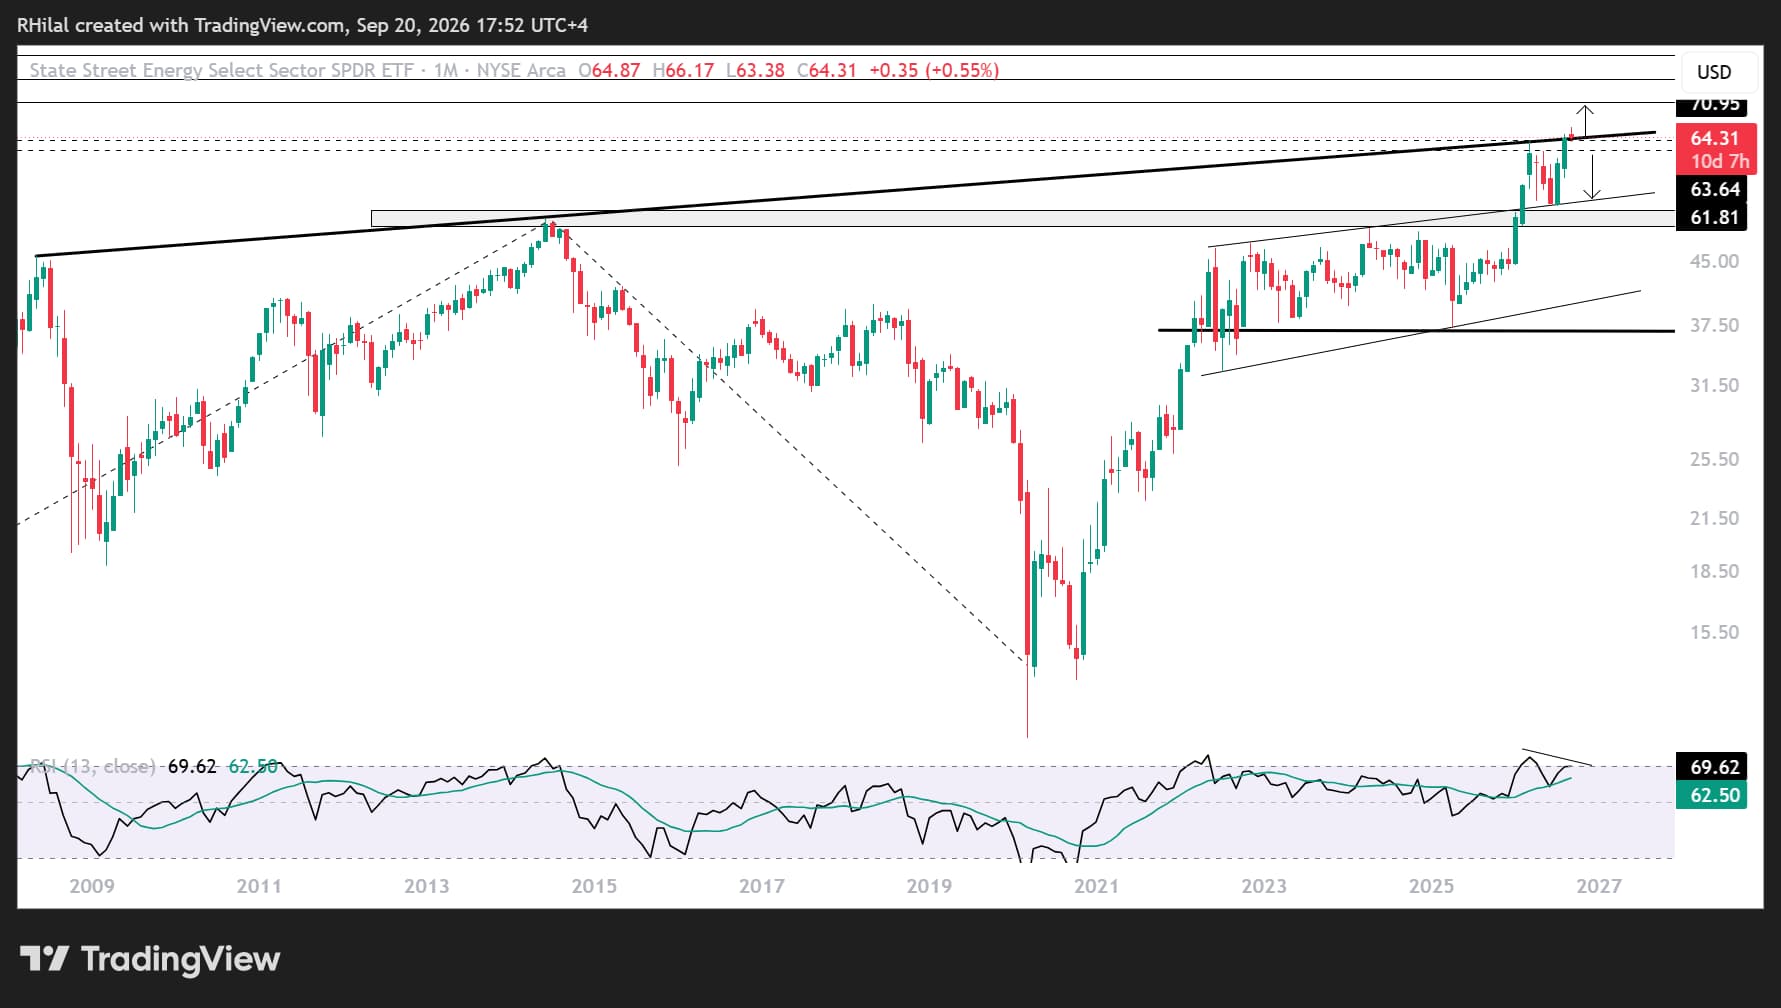
From an ETF perspective, XLE reflects the broader performance of the energy sector.
Price action broke above a major 2008–2026 resistance level, which turned into support in September 2026. For now, that support is holding above $63.50.
The price structure remains consistent with persistent geopolitical tensions and signals potential long-term stress across the energy market.
Bullish scenario: Holding above $63.50 and reclaiming the $65.50 area would reinforce the bullish forecast and open the door to new record highs.
Upside targets include the Fibonacci extension levels of the 2002–2014–2020 cycle near $68, $73 and $77.
This scenario would likely align with a broader escalation scenario.
Bearish scenario: A breakdown below the $61–$60 zone would reaffirm the strength of the multi-year resistance level and pressure XLE into another corrective cycle, targeting $58 and $51.
This scenario would likely align with broader de-escalation across geopolitical tensions.
Written by Razan Hilal, CMT
Follow on X: @Rh_waves
Latest market news










Web Trader platform
Our sophisticated web-based platform is packed with features.
Open an account today
Experience award-winning platforms with fast and secure execution.
Economic calendar
Related articles

Bitcoin Forecast: BTC/USD Back to $80K Ahead of Warsh’s Jackson Hole Speech
After surging over $15,000 in the past 10 days alone, there is risk of a near-term pullback if Warsh says anything remotely hawkish at Jackson Hole - what are the levels to watch from here?


Euro Forecast: Will Core PCE Tip the Scales for the Fed?
The last Core PCE before the Fed's September meeting will mark 65 straight months above the central bank's 2% target - will it be enough to push the FOMC toward a rate hike?

EUR/USD forecast: Technical Tuesday | August 25, 2026
The relative calm in the energy and bond markets have allowed the US dollar and equities to make a slightly positive start to the week. America’s economic war on Iran also failed to trigger any panic, leaving investors with little to chew over until the release of US inflation data on Wednesday and Kevin Warsh’s speech at the Jackson Hole Symposium on Friday.
