


US Dollar Technical Forecast: USD Surges to Fresh Yearly High – 100 Break at Stake 3 13 2026
The Dollar has surged more than 5% off the yearly lows to new yearly highs and now confronts pivotal resistance. The next close could define the breakout.
Written by
Michael Boutros
Sr. Technical Strategist
US Dollar Index Technical Forecast: USD Weekly Trade Levels (DXY)
- DXY has surged more than 5% off the yearly lows with the index breaking to fresh yearly highs as the war in Iran ranges on.
- Price is now testing a major resistance band just above the 100-handle, a key technical pivot for the bulls.
- A sustained weekly close above this barrier would confirm breakout continuation toward 101, while failure here risks a pullback toward layered support.
- Federal Reserve interest rate decision on tap next week- updated SEP will be critical.
- Resistance 100.15/42 (key), 101.14, 102.86/99- Support 98.90, 98.24 (key), 97.15
The US Dollar has extended its recovery sharply from February lows, accelerating into fresh yearly highs as momentum stretches to the highest levels in over a year. The rally has carried DXY into a historically significant resistance cluster centered around the 100-handle, an area that has acted as a technical pivot in prior cycles. With the Federal Reserve decision approaching and volatility elevated, the market faces a decisive inflection point. A confirmed break above this ceiling would reinforce the broader recovery trend, while rejection could invite a near-term retracement after an extended advance. Battle lines drawn on the DXY weekly technical chart.
Review my latest Weekly Strategy Webinar for an in-depth breakdown of this USD setup and more. Join live on Monday’s at 8:30am EST.
US Dollar Price Chart – USD Weekly (DXY)
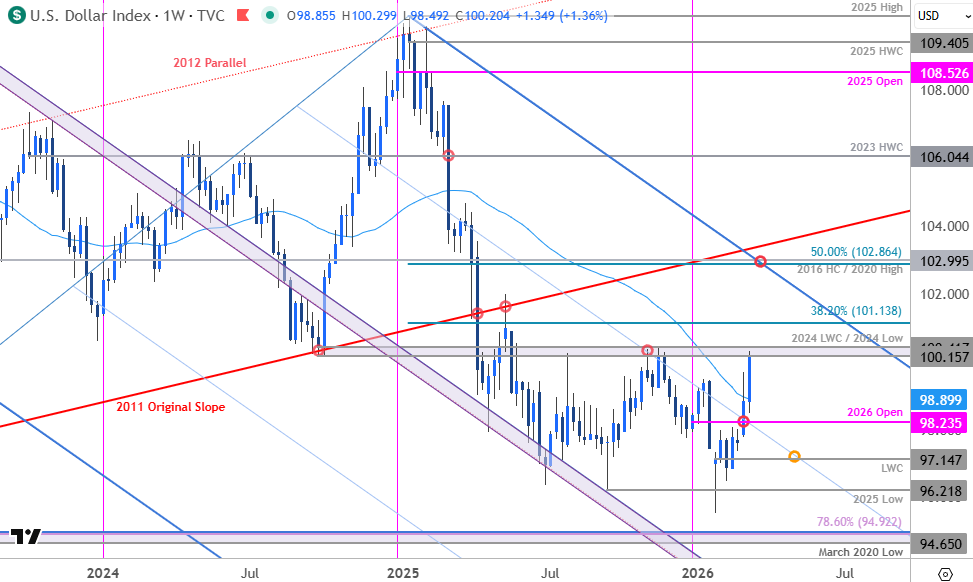
Chart Prepared by Michael Boutros, Sr. Technical Strategist; DXY on TradingView
Technical Outlook: In last month’s US Dollar Technical Forecast we noted that DXY was trading just above support and that, “From a trading standpoint, losses would need to be limited to 96.22 IF price is heading higher on this stretch with a close above 98.55 needed to suggest a larger reversal is underway.” The index turned higher the following week with DXY extending more than 3.9% off the February lows to fresh yearly highs.
The rally is now testing pivotal resistance at 100.15/42- a region defined by the 2024 swing low, the July high, the November close high, and the 2024 low-week close (LWC). The focus is on a reaction off this mark heading into next week with a breach / weekly close above needed to fuel the next major leg of the US Dollar advance. Subsequent resistance objectives are eyed at the 38.2% retracement of the 2025 decline at 101.14 and the 50% retracement, the 2026 high close, and the 2020 high at 102.86/99. Note that the upper parallel of the 2025 pitchfork converges on this threshold over the next few weeks- look for a larger reaction there IF reached.
Initial support now rests with the 52-week moving average (currently ~98.90) and is backed by the 2026 yearly open at 98.24. Broader bullish invalidation is now raised to the low-week close (LWC) at 97.15. Ultimately a break / weekly close below this level would be needed to suggest a more significant high is in place and threaten resumption of the broader downtrend.

Bottom line: U.S. Dollar has rallied into pivotal resistance with the index poised to mark the largest single-weekly advance since November of 2024. The focus is on inflection off this zone next week. From a trading standpoint, losses should be limited to the 98.90 IF price is heading for a breakout on this stretch with a close above 100.42 needed to fuel the next major leg of the advance.
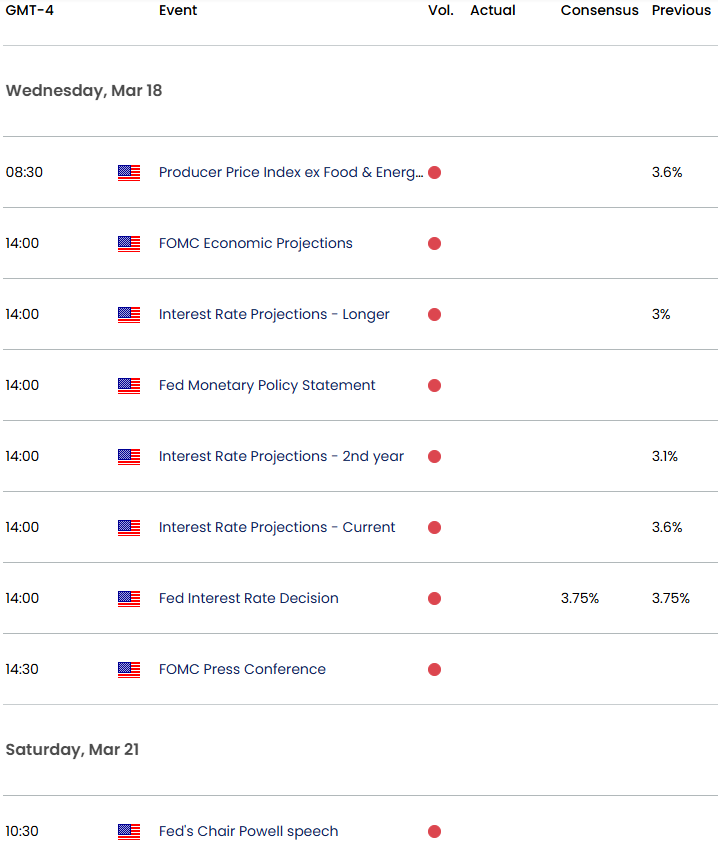
Keep in mind the Federal Reserve interest rate decision is on tap Wednesday and although no change is expected, traders will be closely eyeing the update Summary of Economic Projections. The recent surge in oil prices caused by the ongoing war in Iran has fueled concerns over the inflation outlook. With last week’s dismal Non-Farm Payrolls report showing signs of weakness in the labor markets, the Fed’s dual mandate is once again at odds with the risk to inflation weighted to the topside while the employment market softens. The duration of the conflict will be key and if higher energy prices become persistent, the Fed may be less likely to cut rates.
Fed Fund Futures
Source: CME
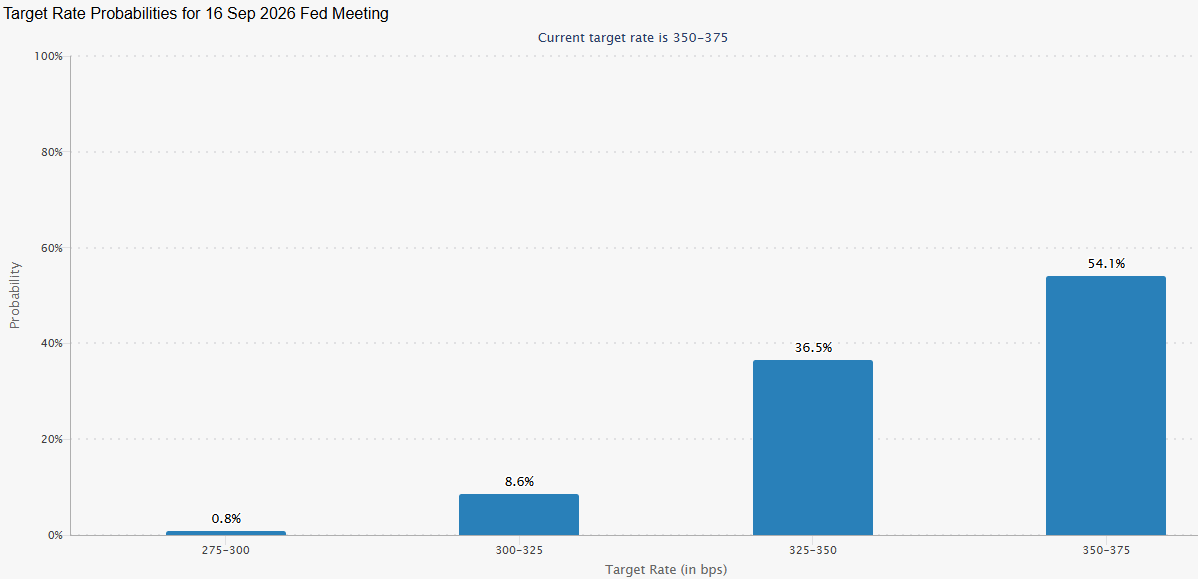
Markets have continued to push out expectations for the next rate cut with the September decision now showing just a 46% probability the Fed will lower rates. This is a meaningful change from the pre-war expectations when markets were heavily priced for a July cut. The US Dollar remains the beneficiary of this shift and the focus next week will be on the updated interest rate dot-plot as investors gauge the central bank’s appetite for lower rates amid the ongoing war. Keep your eyes on the headlines and watch the weekly closes here for guidance. Review my latest US Dollar Short-term Outlook for a closer look at the near-term DXY technical trade levels.
Key Economic Data Releases
Economic Calendar - latest economic developments and upcoming event risk.
Active Weekly Technical Charts
- Australian Dollar (AUD/USD)
- British Pound (GBP/USD)
- Gold (XAU/USD)
- Canadian Dollar (USD/CAD)
- S&P 500, Nasdaq, Dow
- Swiss Franc (USD/CHF)
- Crude Oil (WTI)
- Bitcoin (BTC/USD)
- Japanese Yen (USD/JPY)
- Euro (EUR/USD)
--- Written by Michael Boutros, Senior Technical Strategist
Follow Michael on X @MBForex







Web Trader platform
Our sophisticated web-based platform is packed with features.
Open an account today
Experience award-winning platforms with fast and secure execution.
Economic calendar
Related articles

Euro Short-term Outlook: EUR/USD Pullback Nears Pivotal Uptrend Support 8 28 2026
Warsh's comments accelerated the EUR/USD selloff, raising the stakes as buyers look to stabilize the broader recovery.

Nasdaq 100 Forecast: NDX slips ahead of Fed Chair Warsh’s speech
U.S. stocks are edging lower on Friday, giving back some of yesterday's gains after Nvidia's strong outlook revived the tech trade. The focus has now shifted firmly to Fed Chair Kevin Warsh's Jackson Hole speech, with investors looking for more clarity on the outlook for interest rates.


EUR/USD forecast: All eyes on Warsh at Jackson Hole - Forex Friday
For much of this week, the EUR/USD has been edging lower with the US dollar regaining some ground after last week’s sell-off that was triggered, in part, by the bond market worries. Investors have been unwilling to bet further against the US dollar so far this week ahead of Kevin Warsh’s keynote speech at the Jackson Hole summit, due later today.
