


USD/JPY Forecast: Can Dollar Strength Drive the Pair Toward 170–180?
The outlook for USD/JPY remains constructive as a hawkish Federal Reserve, resilient US dollar, and renewed geopolitical risks continue supporting the pair near the critical 160 area.
Written by
Razan Hilal
Market Analyst
The outlook for USD/JPY remains constructive as a hawkish Federal Reserve, resilient US dollar, and renewed geopolitical risks continue supporting the pair near the critical 160 area.
With USD/JPY stabilising around levels last seen in the late 1980s, markets are increasingly questioning whether another structural rally could emerge toward 170 and eventually 180.
Key Catalysts to Watch
Several macro drivers are likely to determine whether the next bullish leg develops:
- FOMC minutes and any change in expectations for Fed policy. Markets continue to price a meaningful probability of another rate hike during Q4 2026.
- Bank of Japan intervention risk, both verbal and direct, as USD/JPY approaches multi-decade highs.
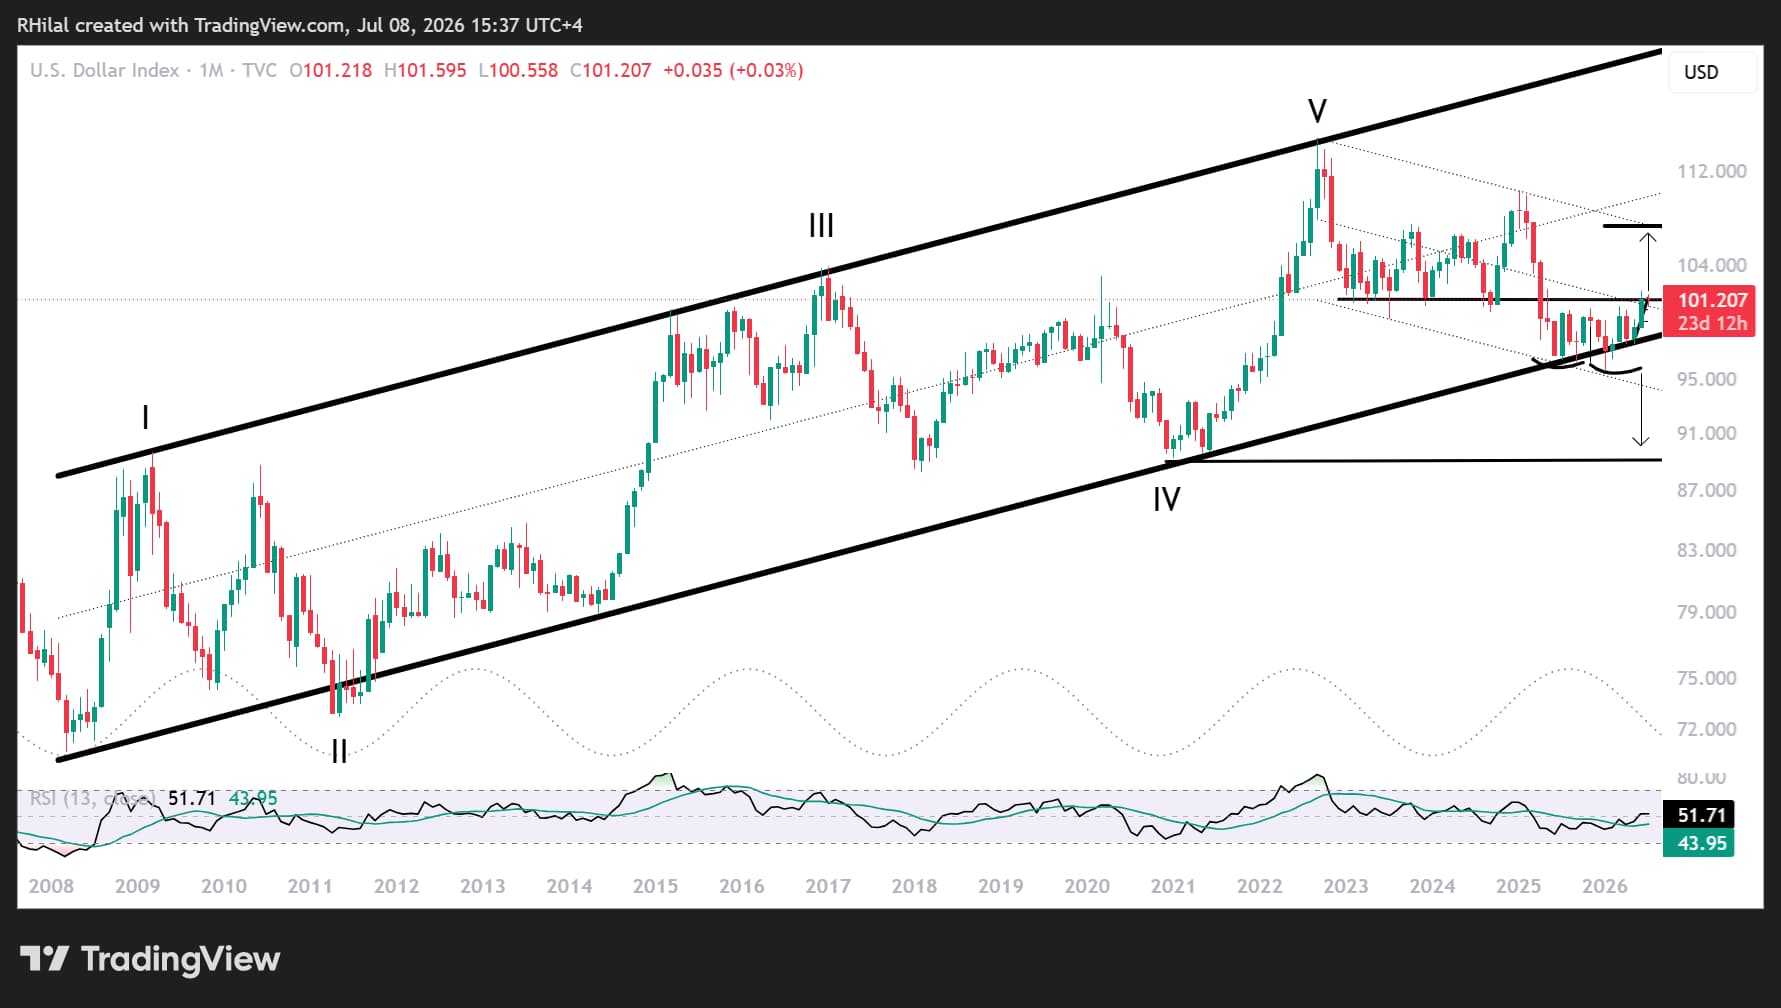
- A sustained DXY breakout above 102, which would reinforce broad US dollar strength.
- Renewed geopolitical risks surrounding the Strait of Hormuz, where higher oil prices could reshape inflation expectations and influence monetary policy expectations.
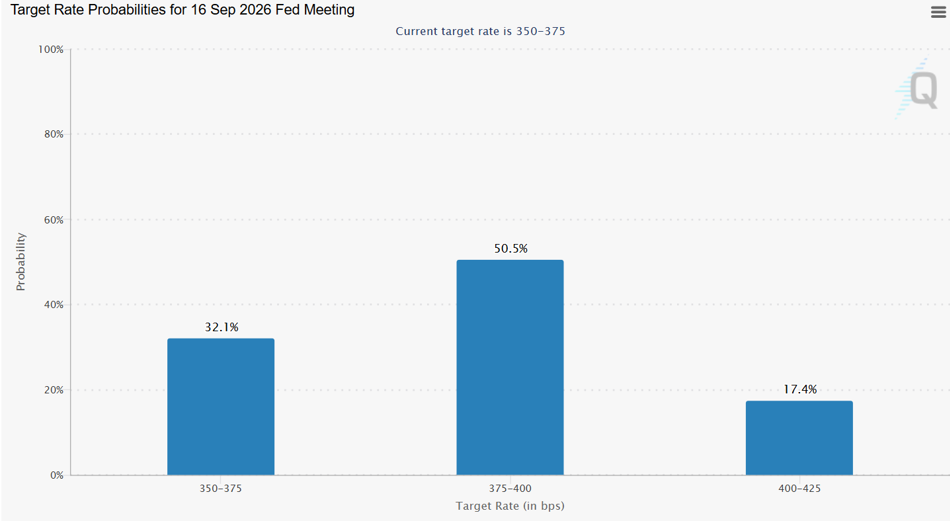
Source: CME FedWatch Tool
Markets continue to price expectations well ahead of policy decisions. While the dollar remains fundamentally supported, incoming inflation, employment, and growth data between now and September will ultimately determine whether the dollar strength continues to strengthen.
DXY Price Forecast: Monthly Time Frame (Log Scale)
Source: TradingView
USD/JPY remains fundamentally tied to the direction of the US Dollar Index.
As long as DXY continues holding above the critical 100.30–99.30 support zone, the broader bullish structure remains intact.
This area has consistently attracted buyers throughout 2026 and continues to define the longer-term trend.
A sustained breakout above 102 would likely confirm a continuation toward:
- 102.80
- 104.50
- 107.00
—the upper boundary of the long-term descending channel that has contained price action since 2022.
Such a move would reinforce dollar strength across global currency markets while increasing downside pressure on major currencies and precious metals.
It would also strengthen the technical case for USD/JPY to challenge the 170–180 region discussed below.
The dollar's outlook remains closely linked to three dominant themes:
- Higher-for-longer Federal Reserve policy.
- Inflation developments.
- Energy prices and renewed geopolitical risks.
I discuss these levels regularly during my Daily MENA Market Call. Register here
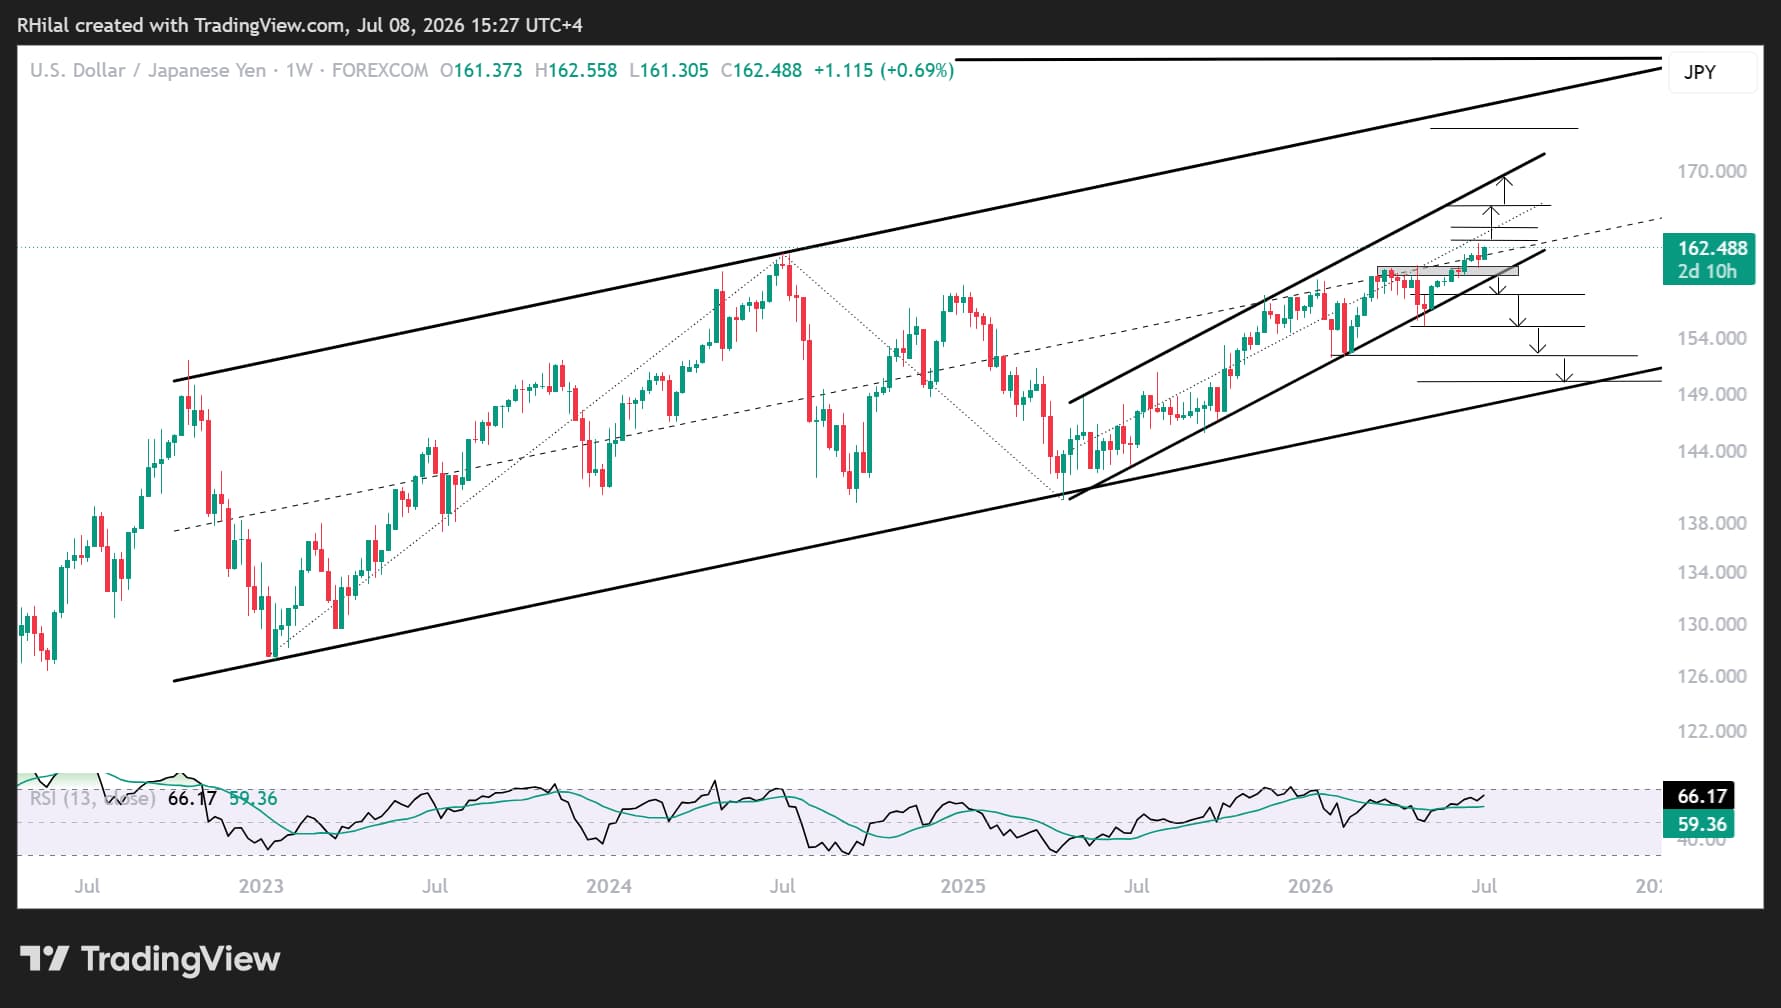
USD/JPY Weekly Time Frame (Log Scale)
Source: TradingView
USD/JPY Approaches Multi-Decade Resistance
From a weekly perspective, USD/JPY continues respecting the ascending channel that has guided the uptrend since 2022. At the same time, price remains inside a shorter-term rising channel that has developed over the past year.
Together, these two structures continue to define the broader bullish trend. The pair is now approaching one of the most important technical areas on the chart: 163
This level represents:
- Midpoint of the broader ascending channel since 2022
- Upper boundary of the one-year rising channel.
Bullish Scenario
A sustained breakout above 163 would strengthen the broader bullish trend and expose:
- 166
- 170
These levels coincide with:
- The upper boundary of the one-year ascending channel.
- The 61.8% Fibonacci extension of the May 2025–April 2026–May 2026 advance.
Should bullish momentum continue, attention would shift toward:
- 173
- 178–180
These represent the upper boundary of the longer-term ascending channel that has guided price action since 2022. However, intervention risk from the Bank of Japan would likely increase substantially as USD/JPY approaches these historically significant levels.
Momentum indicators also suggest weekly conditions are becoming increasingly overbought, implying upside may become more gradual unless momentum strengthens further.
Bearish Scenario
The lower boundary of the one-year ascending channel remains the key support zone.
A sustained break below:
- 160.40
- 159.40
would increase the probability of a deeper corrective move toward:
- 158.00
- 155.00
A break below those levels would expose the longer-term ascending trendline support near 149, which has guided the broader uptrend since 2022.
Although the secular trend remains bullish, corrective pullbacks should be expected as the pair approaches historically significant resistance.
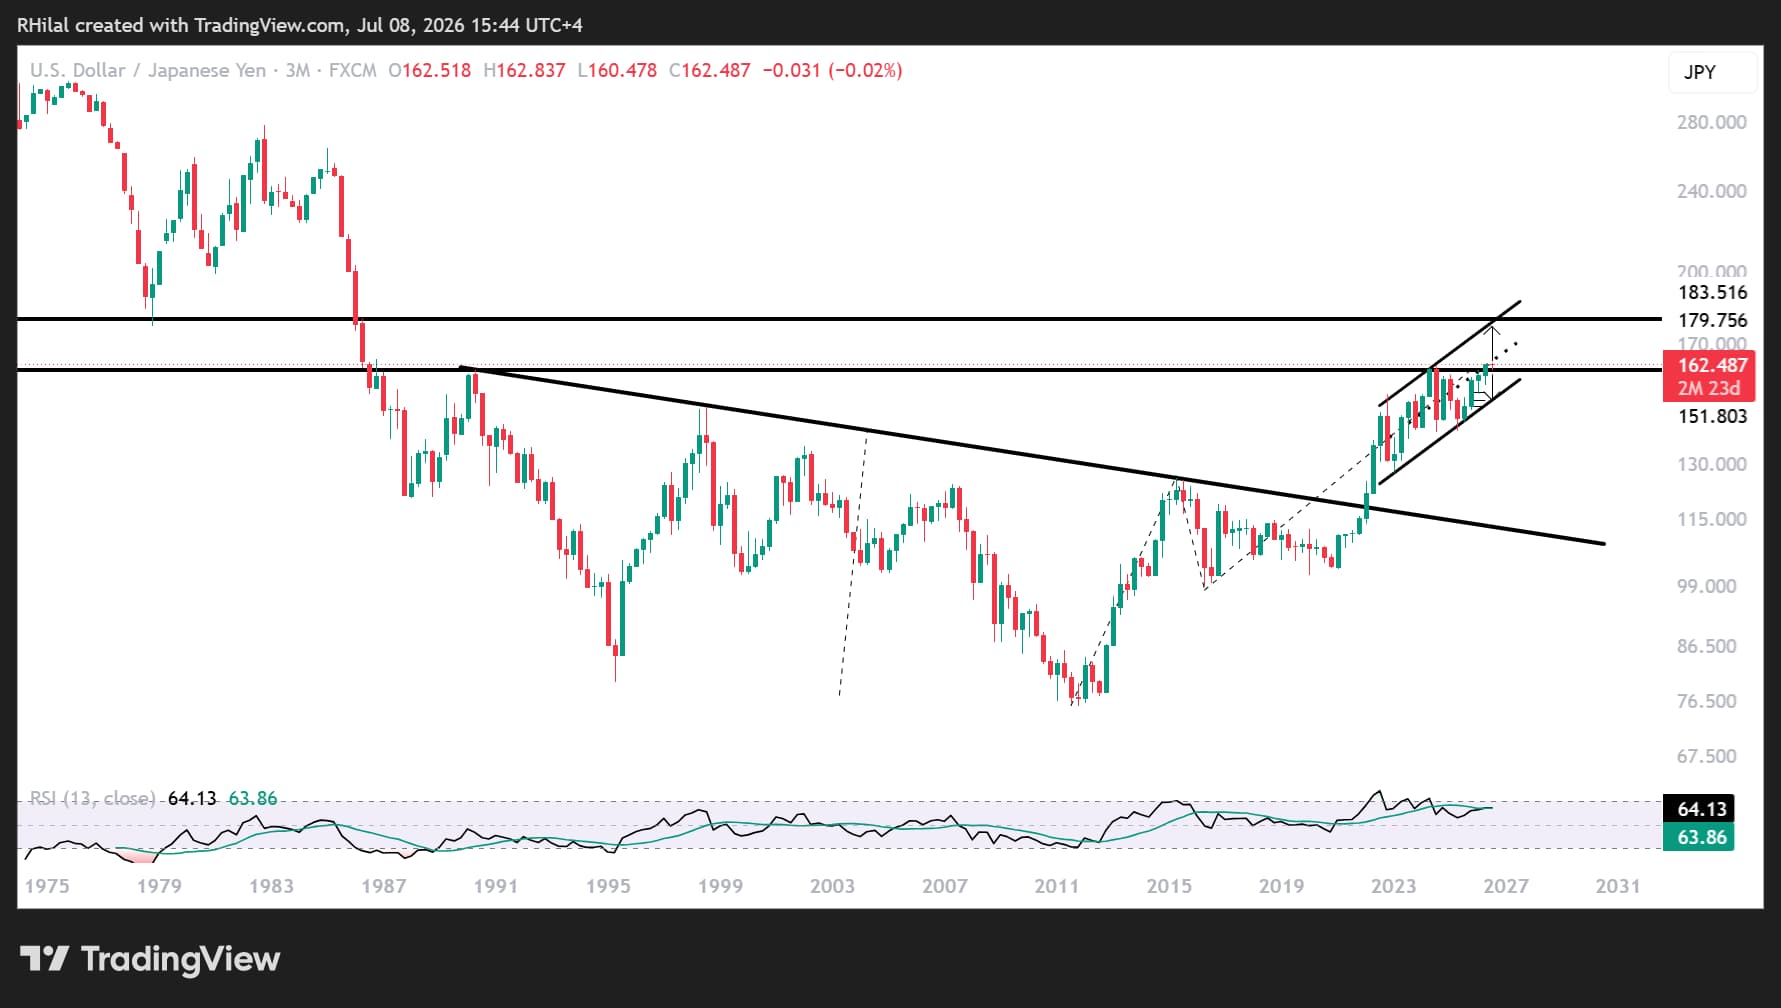
Three-Month Time Frame (Log Scale)
Source: TradingView
Viewing USD/JPY on the quarterly chart places the current rally into a broader historical context.
The 163 region closely aligns with resistance originating from the highs of the late 1980s and early 1990s.
This reinforces the significance of any sustained breakout beyond current levels.
Unlike shorter-term charts, the quarterly timeframe illustrates that a move above 163 would represent much more than another short-term rally—it would mark a structural breakout from one of the most significant resistance zones of the past several decades.
Could USD/JPY Reach 180?
While 180 remains a longer-term scenario rather than a near-term forecast, the technical structure suggests it cannot be dismissed if current macro conditions persist.
A sustained breakout above 163, combined with continued US dollar strength, higher-for-longer Fed expectations, and only limited effectiveness from BOJ intervention, could gradually expose the former support region from the early 1980s near 180.
This area is likely to represent the next major long-term resistance before a more meaningful correction develops.
Ultimately, the balance between a hawkish Federal Reserve and a cautious Bank of Japan will determine whether USD/JPY simply retests historical highs—or begins another structural advance toward the 170–180 region.
Written by Razan Hilal, CMT
Follow on X: @Rh_waves







Web Trader platform
Our sophisticated web-based platform is packed with features.
Open an account today
Experience award-winning platforms with fast and secure execution.
Economic calendar
Related articles

Euro Short-term Outlook: EUR/USD Pullback Nears Pivotal Uptrend Support 8 28 2026
Warsh's comments accelerated the EUR/USD selloff, raising the stakes as buyers look to stabilize the broader recovery.


Nasdaq 100 Forecast: NDX slips ahead of Fed Chair Warsh’s speech
U.S. stocks are edging lower on Friday, giving back some of yesterday's gains after Nvidia's strong outlook revived the tech trade. The focus has now shifted firmly to Fed Chair Kevin Warsh's Jackson Hole speech, with investors looking for more clarity on the outlook for interest rates.


EUR/USD forecast: All eyes on Warsh at Jackson Hole - Forex Friday
For much of this week, the EUR/USD has been edging lower with the US dollar regaining some ground after last week’s sell-off that was triggered, in part, by the bond market worries. Investors have been unwilling to bet further against the US dollar so far this week ahead of Kevin Warsh’s keynote speech at the Jackson Hole summit, due later today.
