


USD/JPY, Oil Forecast: Two trades to watch 120826
USD/JPY Looks Towards 160 Ahead of U.S. CPI Data. Oil rises for a sixth straight session on Middle East supply worries.
Written by
Fiona Cincotta
Senior Market Analyst

USD/JPY Looks Towards 160 Ahead of U.S. CPI Data
USD/JPY is creeping higher, even after joint intervention by Tokyo and Washington pulled the pair from 164 to 155. Just a week later, U.S. dollar bulls are already pushing the pair back towards the danger zone.
The yen has already given back nearly half of its intervention rally after the U.S. and Japan stepped in to stop the pair from reaching a fresh 40-year high. While the move worked as a short-term shock, it appears less capable of creating a lasting change in direction.
With Japanese interest rates still well below those in the U.S., the carry trade remains attractive. Investors can continue to borrow cheaply in yen and buy higher-yielding dollar assets, putting renewed pressure on the Japanese currency.
Attention now turns to U.S. CPI data, which is expected to show headline CPI rising 0.1% month-on-month and 3.4% year-on-year, down from 3.5%. Core CPI is expected to rise 0.2% month-on-month and 2.5% year-on-year, down from 2.6%.
A hotter-than-expected reading, particularly CPI of 0.3% or more on a monthly basis, could strengthen expectations of a September rate hike. This could push U.S. Treasury yields higher, making dollar assets more attractive and potentially lifting USD/JPY above 160.
Meanwhile, cooler-than-expected inflation, particularly following Friday's weaker-than-expected non-farm payroll report, could put pressure on Treasury yields and give the pair some breathing room.
U.S. CPI data is therefore key for setting expectations for the September Fed meeting and could also influence Federal Reserve Chair Walsh's speech at the Jackson Hole Symposium later this month.
USD/JPY Forecast – Technical Analysis
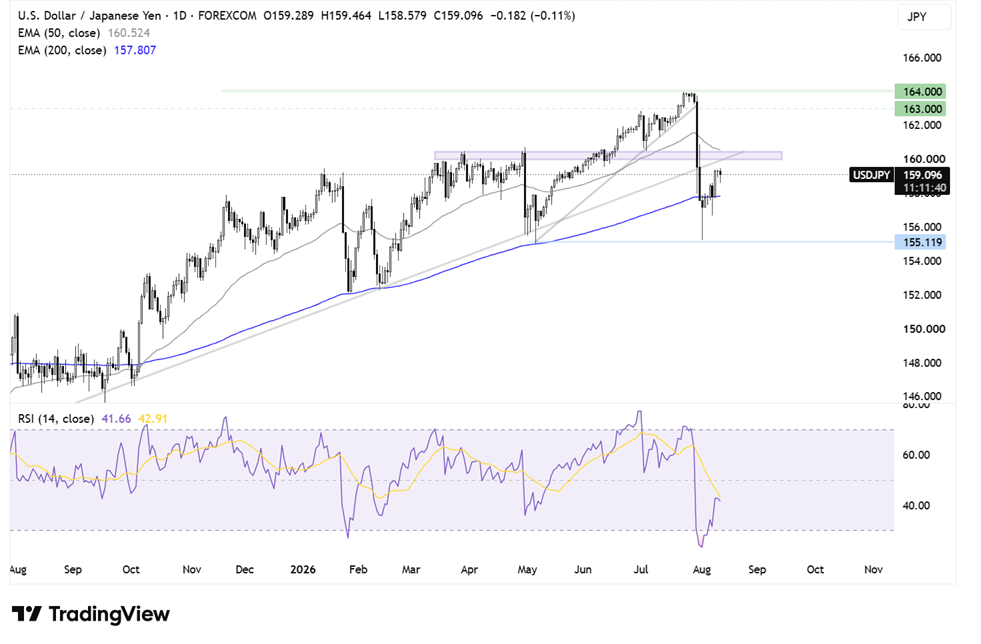
USD/JPY has recovered from the 155 low, rising back above the 200 EMA and heading towards the 160 resistance zone. There is a confluence of the multi-month rising trend line, horizontal resistance and the 50 EMA around this level.
A rise above 160 would put bulls firmly back on track and bring 163, the round number, and 164, the 2026 high, into focus.
On the downside, support is seen at 157.80, the 200 EMA. Below here, attention turns back towards 155, the August and May lows.
Oil Rises For A Sixth Straight Session On Middle East Supply Fears
Oil prices are rising on Wednesday amid ongoing concerns about supply disruptions in the Middle East, although data showing rising U.S. oil inventories could limit the upside for now.
Oil prices are rising for a sixth straight day, with WTI up more than 7% so far this week. The rise comes amid ongoing supply concerns, as Iran's top security officials said the Strait of Hormuz will remain closed unless the U.S. accepts Iran's conditions to end the war.
Shipping data shows the number of vessels transiting the Strait fell to a low of eight on Tuesday, significantly below the 130 vessels that passed through the crucial waterway each day before the war.
Separately, Iran-aligned Houthis reported attacks on ships in both the Strait of Hormuz and Bab el-Mandeb, adding to concerns over oil supply.
According to the International Energy Agency, global oil supply is expected to fall by 4.3 million barrels per day, or around 4%, this year, as renewed hostilities in the Middle East since July put the oil market into a deficit. This is a larger drop than the 3.7 million barrels per day forecast in the IEA's July report, taking the IEA's latest forecast for global supply to 102.02 million barrels per day.
However, according to API data, U.S. crude inventories rose sharply by 9.1 million barrels last week, while gasoline and distillate inventories fell by 1.5 million barrels.
Attention will be on EIA data later today to see whether the inventory build is confirmed by official data. If it is, this could provide some relief from the current supply concerns and limit further gains in oil prices.
For now, ongoing hostilities and the closure of the Strait of Hormuz are likely to keep oil prices supported.
Oil Forecast – Technical Analysis
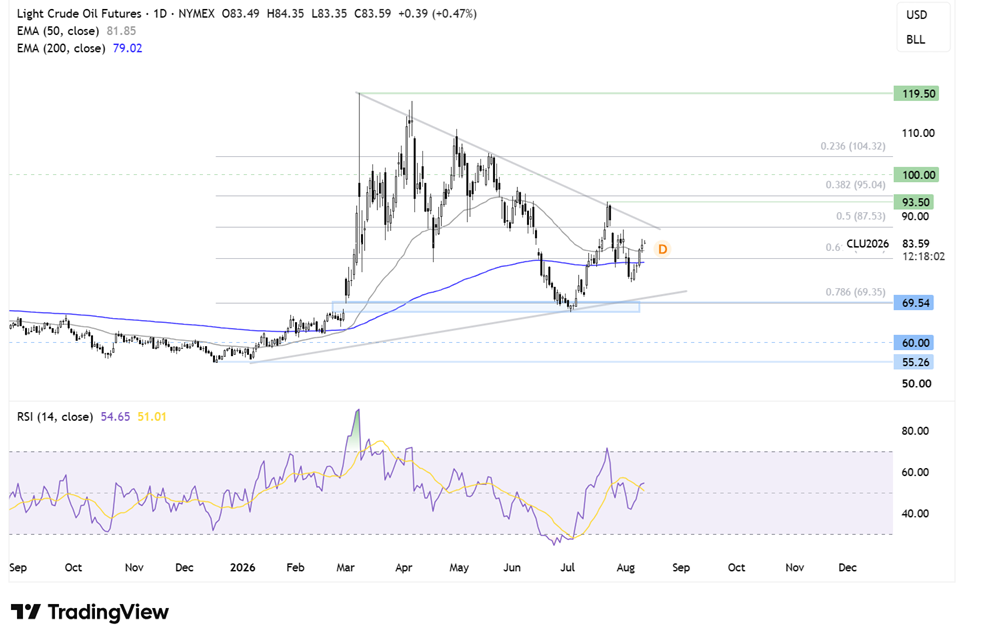
Oil is trading within a symmetrical triangle pattern. The price has recovered from $75, pushing above the 50 and 200 EMAs.
With the RSI above 50, buyers will look to extend gains towards $88, the 50% Fibonacci retracement of the move from the $55 low to the $120 high, as well as the falling trend line resistance.
A rise above here brings the 95 Fibonacci retracement level and the July high into focus. A break above this level would create a higher high and open the door towards $100.
On the downside, immediate support is seen at the 50 EMA at $81.80 and $80, the psychological level, followed by the 200 SMA and the 61.8% Fibonacci retracement level.
A break below these levels would bring $75, the August low, back into focus and could see sellers gain traction towards the $70 support zone.
Related tags:







Web Trader platform
Our sophisticated web-based platform is packed with features.
Open an account today
Experience award-winning platforms with fast and secure execution.
Economic calendar
Related articles

Nasdaq 100 Forecast: NDX slips ahead of Fed Chair Warsh’s speech
U.S. stocks are edging lower on Friday, giving back some of yesterday's gains after Nvidia's strong outlook revived the tech trade. The focus has now shifted firmly to Fed Chair Kevin Warsh's Jackson Hole speech, with investors looking for more clarity on the outlook for interest rates.

S&P 500 Forecast: SPX after Nvidia revives confidence in the AI trade
U.S. stocks are heading higher on Thursday, with technology leading the move after Nvidia's stronger-than-expected outlook revived confidence in the AI trade.

DAX, GBP/USD Forecast: Two trades to watch 2708
DAX rises as Nvidia boosts AI trade ahead of Jackson Hole. GBP/USD slips below 1.36 as Fed expectations shift.