


USD/JPY outlook: Central bank guidance key with a dash of Japanese fiscal pressure
The usual USD/JPY rates relationship broke down sharply earlier this month, but with speculative shorts flushed out and Japan’s curve re-steepening, the pair heads into the Fed and BOJ with far more two-way risk.
Written by
David Scutt
Market Analyst
- Yen surge defies historic relationships with rising US yields
- Short covering likely amplified early-September yen rally
- Fiscal concerns add pressure Japanese long-end yields
- Fed and BOJ guidance to dictate directional risk
The Japanese yen strengthened rapidly earlier this month despite a relentless rise in US nominal and real yields, an outcome that has been almost unheard of in modern times.
Some of that can be explained by the violent unwind of speculative yen shorts and aggressive BOJ repricing, along with intervention from US and Japanese authorities. But there may be other influences coming from the Japanese bond market, which by historical standards has delivered some unusually wild moves recently.
However, with USD/JPY reversing higher on Tuesday into a risk-laden period headlined by Fed and BOJ interest rate decisions later this week, downside risks that were evident earlier this week now look far more balanced in nature.
Yen strength defies usual rates playbook
USD/JPY has long been known as a play on relative interest rates, which makes the movements seen in early September highly unusual.
Source: LSEG
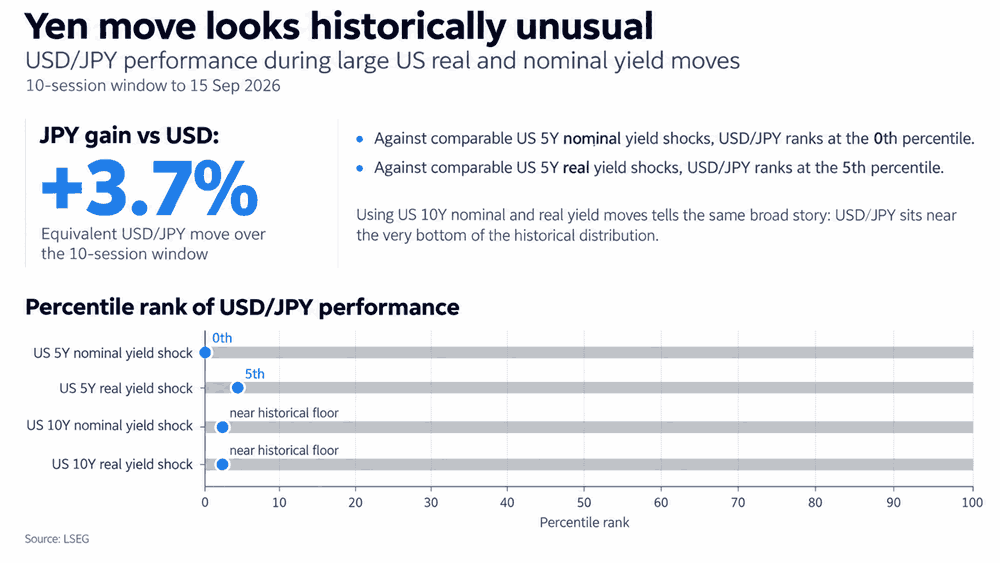
Over the 10 sessions to September 15, the yen gained 3.7% against the US dollar despite a sharp rise in both nominal and real US Treasury yields. Historically, that kind of performance is extremely rare.
Looking back at comparable moves in five-year nominal US yields, USD/JPY performance ranked in the 0th percentile of the historical distribution dating back to May 1992. The comparison with five-year real yields, which strip out expected inflation, sat around the 5th percentile over a shorter history dating back to 2003.
A similar message was seen further out the curve with moves in US 10-year nominal and real yields that would normally have been associated with a stronger USD/JPY failing to deliver the upside so often seen in the past.
Of course, relationships can change over time and sometimes vanish entirely. But I suspect that’s not the case here. Instead, it points to other forces being powerful enough to overwhelm what would normally have been a significant tailwind for USD/JPY upside.
Intervention threat flushes yen shorts
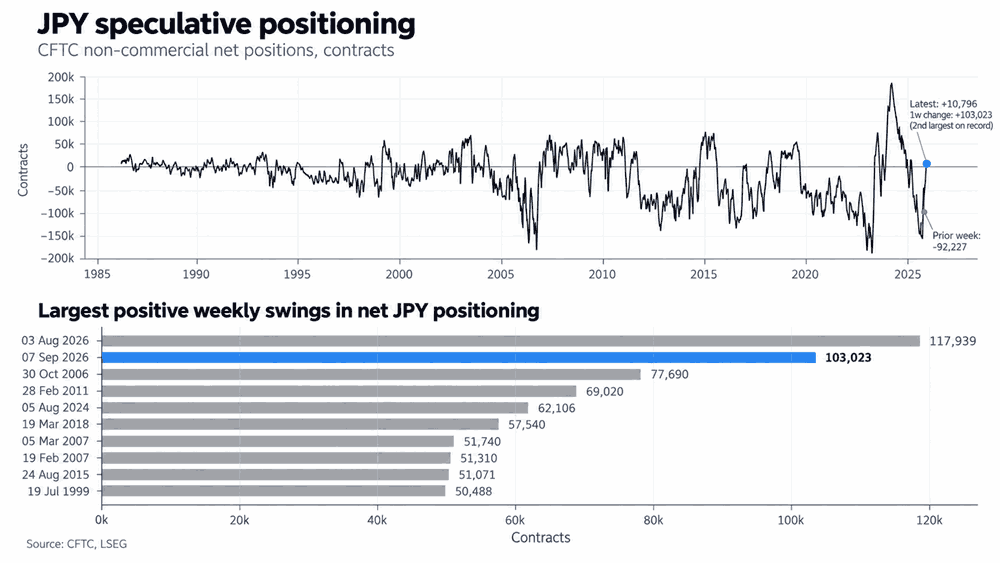
A key factor that may explain the scale of the yen’s move is large-scale short covering among speculators.
Source: LSEG
Japan’s Ministry of Finance delivered record yen intervention in August via the BOJ, which was then followed by unusually forceful rhetoric from US Treasury Secretary Scott Bessent, including his warning to the market that he was now effectively “the house”, while simultaneously egging traders to take him on in shorting the yen.
For now, traders appear to have taken the message on board, with the latest CFTC data revealing the second-largest positive weekly swing in speculative yen positioning on record. With sizeable speculative short positioning flipping positive, that helps explain some of the yen’s unusual outperformance in an environment where it would normally struggle.
Japan’s front end feels BOJ heat
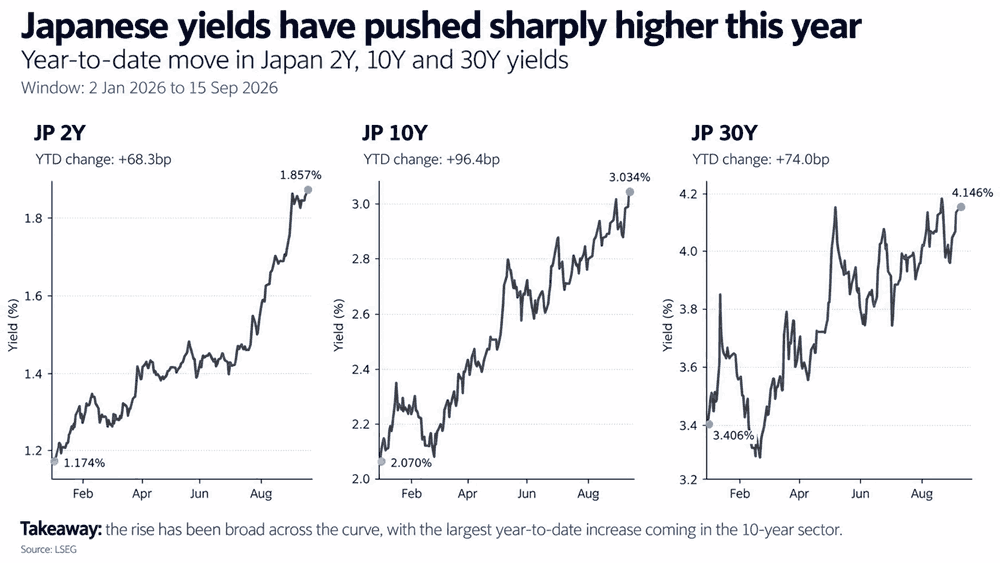
A second consideration has been the hawkish shift in BOJ pricing, which has driven a significant sell-off at the front end of the JGB curve and pushed yields to fresh multi-decade highs as markets moved to price more than three full rate hikes over the coming 12 months.
Source: LSEG
While not the only factor, that repricing has helped drag yields higher further out the curve. Year to date, two-year JGB yields are up around 68bp, 10-year yields around 96bp and 30-year yields roughly 74bp.
The broader rise in Japanese yields has taken some pressure off the yen through the relative-rate channel, narrowing part of the yield disadvantage that has traditionally worked heavily against the currency. Even as US yields have continued to surge, the simultaneous repricing of Japanese rates has meant the relative move has been less one-sided than the US rates story alone would suggest.
JGB curve reversal raises a different yen risk
However, not all bear steepening moves are created equal. When the steepening is being driven by increased term premium around rising fiscal concern, not just global forces which are also evident, it can often have a detrimental impact on the underlying currency, and that may be the case with the yen on this occasion.
Source: LSEG
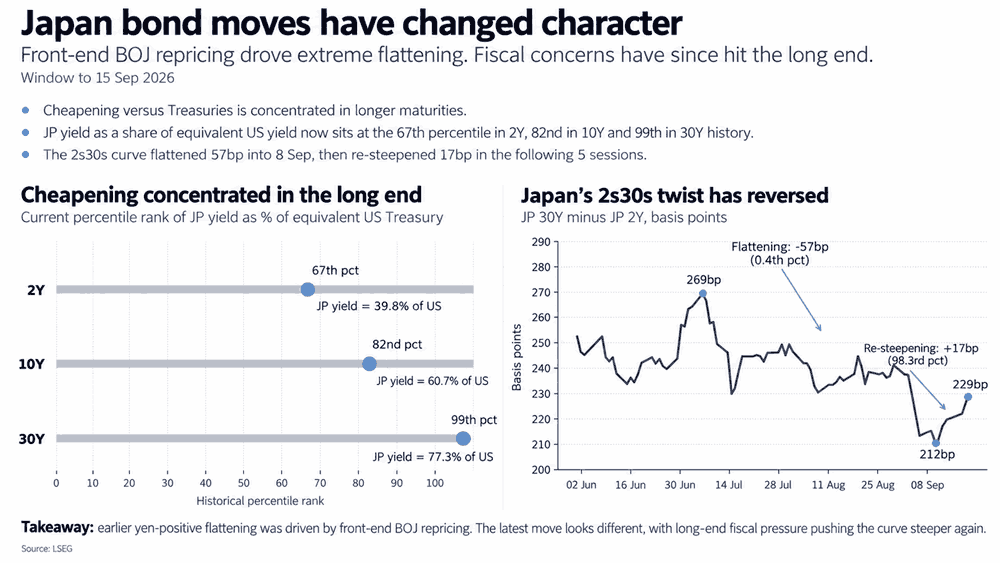
Earlier this month, the front end of the JGB curve sold off aggressively while longer-dated yields fell, producing an extreme flattening episode in the 2s30s curve of almost 57 basis points, a move near unprecedented in modern times.
However, that has since partially reversed with the 2s30s curve re-steepening by 17 basis points over the past five sessions, another historically large move, as long and super-long JGB yields came under pressure following a slew of media reports discussing policy tweaks that may further pressure Japan’s fiscal position.
Among market concerns is the Japanese government’s plan to slash the consumption tax on food for two years, with clear unease that the temporary reduction may ultimately become permanent, creating an ongoing revenue shortfall. Speculation elsewhere about a potentially sizeable increase in Japan’s defence spending is another factor that, if realised, may add further pressure to the fiscal position and weigh on longer and super-long JGBs.
Fed and BOJ guidance takes over
While there are plenty of push and pull factors that may explain what’s been happening with the yen, when it comes to the latter parts of this week, I suspect it will all be about relative rates again.
With the Fed decision less than 24 hours away and the BOJ following on Friday afternoon in Asia, and both widely expected to raise rates by 25 basis points, the decisions themselves may matter less than the guidance around them.
For the Fed, focus will fall on the updated dot plot, voting pattern and Kevin Warsh’s press conference, particularly whether policymakers can live up to the hawkishness priced into the US curve. I suspect that may be difficult, particularly when it comes to the dots, which may create downside risks for USD/JPY.
For the BOJ, the focus will be on the tone of the statement and Governor Ueda’s press conference. With a 25 basis point hike already fully priced, guidance around what comes next is likely to matter more than the decision itself in the absence of updated forecasts.
For a deeper look at both meetings, I covered the key risks in the week-ahead piece here.
USD/JPY downside momentum fading
Source: TradingView
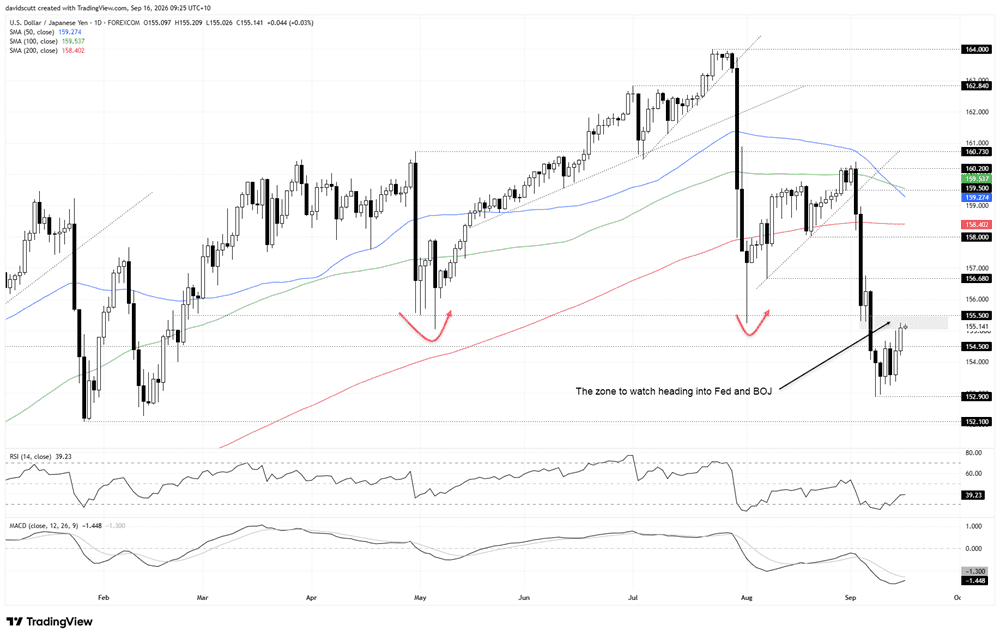
The abrupt unwind earlier this month saw USD/JPY slice beneath the 100 and 200-day moving averages, break the August uptrend and take out several horizontal support levels along the way.
However, after two failures to sustain moves beneath 153 in early September, the price has started printing a sequence of higher lows and has since pushed back above 154.50, a level that has seen plenty of price action on either side despite not being the cleanest technically.
That leaves the 155.00-155.50 region as an important near-term zone. During prior intervention episodes earlier this year, plenty of offers were absorbed around this area before the pair squeezed sharply higher.
As such, a sustained break above 155.50 would improve the probability of a retest of 156.68, a former support level that flipped to resistance earlier this month. Above that, 158.00 and even the 200-day moving average should be on the radar.
On the downside, a move back beneath 154.50 would bring the recent low at 152.90 back into play, with 152.10, a swing low from January, the next meaningful level below.
The oscillators mirror the price action. Momentum still favours the bears, but the strength of the move seen in early September looks to be fading. RSI (14) is pushing back towards 50, while MACD is converging on its signal line in negative territory. The bears still retain the upper hand, but their grip appears to be loosening.
More broadly, the moving averages and sequence of lower highs and lower lows since late July still favour selling into strength rather than buying dips over a longer time horizon. Right now, though, directional risk looks far more balanced in nature.
Latest market news










Web Trader platform
Our sophisticated web-based platform is packed with features.
Open an account today
Experience award-winning platforms with fast and secure execution.
Economic calendar
Related articles

FX Futures Positioning: Dollar Rebound Meets Diverging Forex Bets | COT Report
US dollar longs held firm into Jackson Hole, while euro, yen and commodity FX positioning diverged ahead of ISM and NFP.


EUR/USD forecast: All eyes on Warsh at Jackson Hole - Forex Friday
For much of this week, the EUR/USD has been edging lower with the US dollar regaining some ground after last week’s sell-off that was triggered, in part, by the bond market worries. Investors have been unwilling to bet further against the US dollar so far this week ahead of Kevin Warsh’s keynote speech at the Jackson Hole summit, due later today.


Bitcoin Forecast: BTC/USD Back to $80K Ahead of Warsh’s Jackson Hole Speech
After surging over $15,000 in the past 10 days alone, there is risk of a near-term pullback if Warsh says anything remotely hawkish at Jackson Hole - what are the levels to watch from here?
