


Dow Jones Forecast: Is a New Bearish Bias Emerging Around the DJIA?
Over the past few trading sessions, price action in the Dow Jones Industrial Average has started to show consistent signs of weakness. In fact, the index has already posted a decline of nearly 1.00% over the last five trading days, a development that is beginning to reveal a bearish bias or, at the very least, growing caution across the market.
Written by
Julian Pineda
Market Analyst
Over the past few trading sessions, price action in the Dow Jones Industrial Average has started to show consistent signs of weakness. In fact, the index has already posted a decline of nearly 1.00% over the last five trading days, a development that is beginning to reveal a bearish bias or, at the very least, growing caution across the market. For now, this selling pressure reflects concerns over a more aggressive Federal Reserve, along with additional factors such as rising oil prices, which have started to weigh on short-term confidence and may be limiting the index's upside potential. If these conditions remain in place, selling pressure could continue to gain relevance over the coming sessions.
Is Short-Term Confidence Fading?
These have become challenging sessions for confidence across risk markets. One of the factors affecting recent market dynamics is the ongoing conflict in the Middle East. As tensions persist, WTI crude oil has already climbed above the $100 per barrel mark, increasing concerns about global inflationary pressures. In addition, this scenario could lead to higher costs for industrial and transportation companies, a factor that may affect not only investor sentiment but also several major Dow Jones components directly.
A second key factor is that this backdrop has helped sustain expectations of a more aggressive Federal Reserve in the near term. Markets are not only expecting an interest rate increase at tomorrow’s policy meeting, but there is also growing anticipation that this trend may continue over the coming months. This is already becoming evident in one of the most important alternative markets to equities such as the Dow Jones: the U.S. 10-year Treasury market, where yields remain above the 5.00% level, a mark not seen in years.
The combination of these factors creates an environment in which inflationary pressures could persist and pave the way for higher interest rates over the coming months. This could increase borrowing costs and reduce market liquidity, ultimately affecting consumption and limiting corporate earnings growth in broader terms. As a result, uncertainty surrounding risk assets continues to rise, and this effect is already beginning to show up in the Fear and Greed Index. The indicator currently remains near 29 points and is moving increasingly closer to the "Extreme Fear" zone, reflecting a sustained deterioration in sentiment during recent sessions and suggesting weaker demand for risk assets such as the Dow Jones.
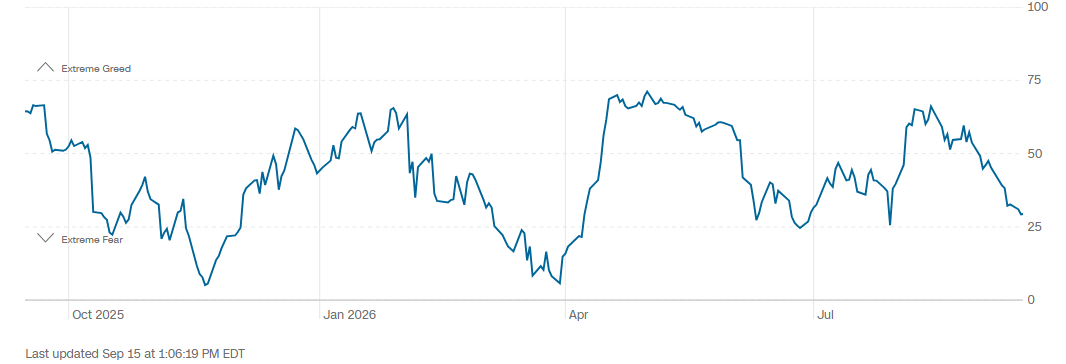
Source: CNN
Against this backdrop, the decline in confidence driven by these factors is also becoming visible among the Dow Jones’ leading components ahead of the Federal Reserve decision. Among the index's ten most significant companies, nearly all are posting negative performances, while only Caterpillar has managed to maintain a modest gain of +0.09% in the short term. This suggests that, broadly speaking, the performance of Dow’s largest companies reflects the same deterioration in sentiment seen recently and highlights how sensitive these firms have become to inflation-related developments and central bank expectations.
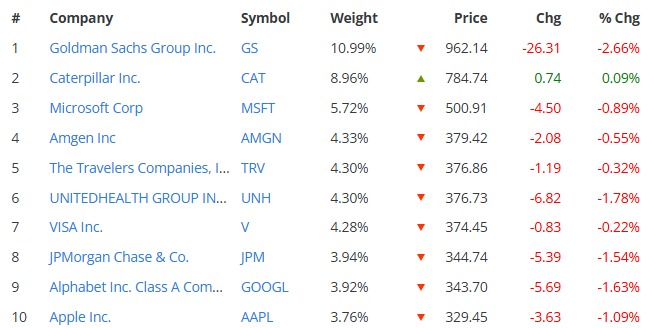
Source: Slickcharts
It is also worth paying attention to activity in the E-mini Dow Jones Industrial futures market. During the September 14 session, trading volume increased significantly and surpassed 180,000 contracts, a level not seen in several weeks. This move becomes particularly relevant because the Dow continues to lose ground while open interest is also increasing. The combination of lower prices, stronger volume, and rising open interest may suggest growing bearish participation, potentially linked to the opening of new short positions. This points to rising activity around the index at a time when market confidence continues to deteriorate.
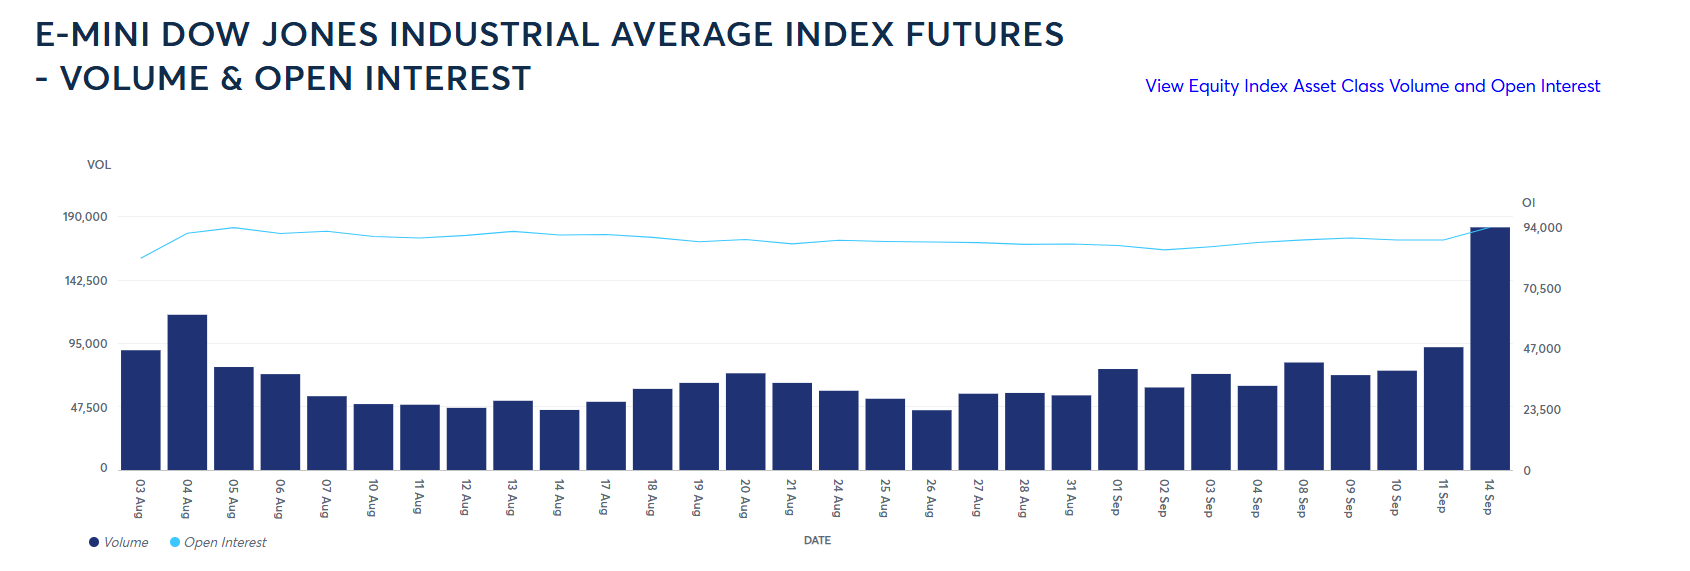
Source: CMEGROUP
Taking all of this into account, current market conditions are becoming increasingly relevant for investor confidence around the Dow Jones. Factors such as rising oil prices, combined with the possibility of a more aggressive Federal Reserve, could continue to weigh on demand for risk assets and make it more difficult for the index to regain momentum. As a result, selling pressure may remain an important part of Dow Jones price action in the sessions ahead.
Dow Jones Technical Forecast
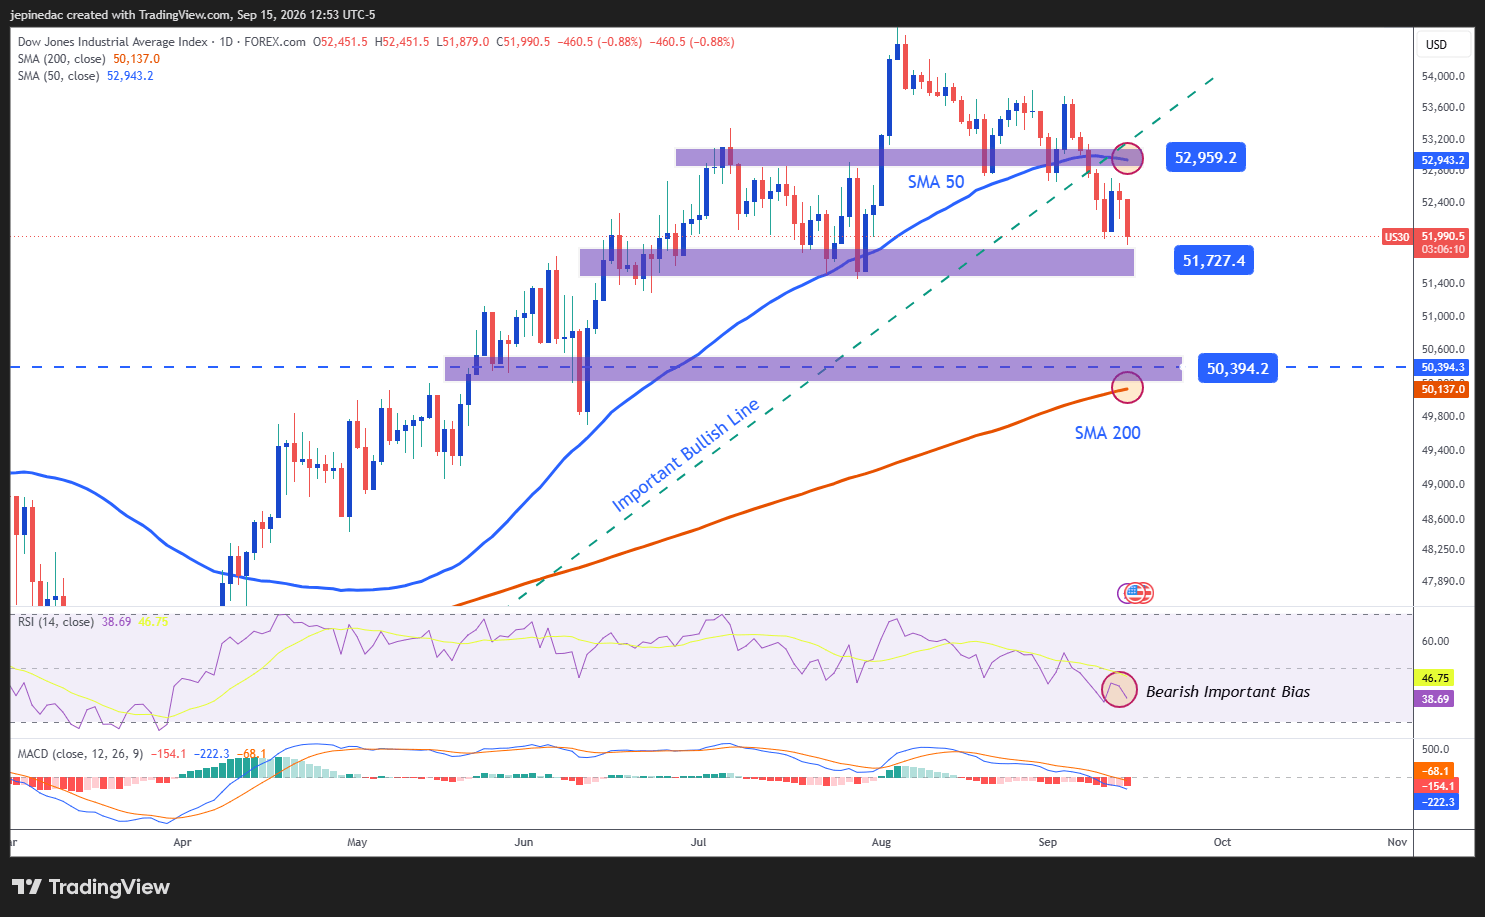
Source: StoneX, Tradingview
- Bearish momentum becomes more evident: Over recent trading sessions, downside pressure in the Dow Jones has become increasingly noticeable. Notably, price action has already produced a decisive break of the most relevant bullish trendline on the chart. If price and selling pressure continue to stabilize around key levels, a more established bearish structure could continue to gain relevance in the coming weeks.
- RSI: The RSI remains below the 50 neutral level, a situation that shows average short-term momentum continues to favor a bearish bias that could remain relevant in the near term.
- MACD: A similar picture can be observed in the MACD, as the indicator's histogram also remains below the 0 level. This reading suggests that the average strength of short-term moving averages continues to favor a bearish dynamic.
Key Levels:
- 52,950 points – Key resistance: This area coincides with the 50-period simple moving average and represents the most important upside barrier on the chart. Price action that manages to return above this level could begin to restore relevance to a forgotten bullish bias and once again highlight the broader uptrend that was significant weeks ago.
- 51,720 points – Near-term barrier: An important retracement area from previous weeks that could generate difficulties for the ongoing bearish move and may even provide room for short-term bullish corrections.
- 50,400 points – Key support: A highly relevant area that not only coincides with lows seen months ago but also aligns with the 200-period simple moving average. Price action that manages to break below this level could significantly alter the chart structure and open the door to a more developed bearish trend in the weeks ahead.
Written by Julian Pineda, CFA, CMT – Market Analyst
Follow him on: @julianpineda25
Related tags:
Latest market news











Web Trader platform
Our sophisticated web-based platform is packed with features.
Open an account today
Experience award-winning platforms with fast and secure execution.
Economic calendar
Related articles

Gold and S&P 500 analysis: What now after Warsh’s hawkish speech?
The dollar surged across the board after the Fed Chair Kevin Warsh surprised with a hawkish-leaning speech at the Jackson Hole summit. All the bearish dollar bets that had been accumulated since last Friday on the back of data weakness and bond market troubles had to be squared and that triggered a short squeeze rally for the dollar. Gold and silver dropped, as a result, as too did bitcoin, while US indices were giving back earlier gains.


DAX and EUR/USD forecast: Lower energy prices, yields offer support
But the question, of course, is how much further oil prices and bond yields can fall. For now, the combination is supportive of risk assets and is helping to sustain a relatively benign decline in the dollar. The focus today will be on US core PCE inflation, due for release shortly, while Nvidia’s second-quarter earnings will provide another test for risk appetite after the US markets close – not just for US indices but for global tech-heavy indices given the influence Nvidia has over the global tech and AI names.

ASX 200 Outlook: Jackson Hole Puts Monday Volatility in Focus
ASX 200 volatility tends to rise after Jackson Hole, while sector correlations highlight the clearest support, resistance and leadership signals.
