


USDJPY, GBPUSD Price Outlook: Breakout Risks Rise as DXY Tests 101.20
USDJPY and GBPUSD Price Outlook: Dollar breakout risks remain in focus as the US Dollar Index (DXY) approaches the critical 101 level, USDJPY holds above 161, and GBPUSD trades below a key multi-month support zone.
Written by
Razan Hilal
Market Analyst
Dollar breakout risks remain in focus as the US Dollar Index (DXY) approaches the critical 101 level, USDJPY holds above 161, and GBPUSD trades below a key multi-month support zone.
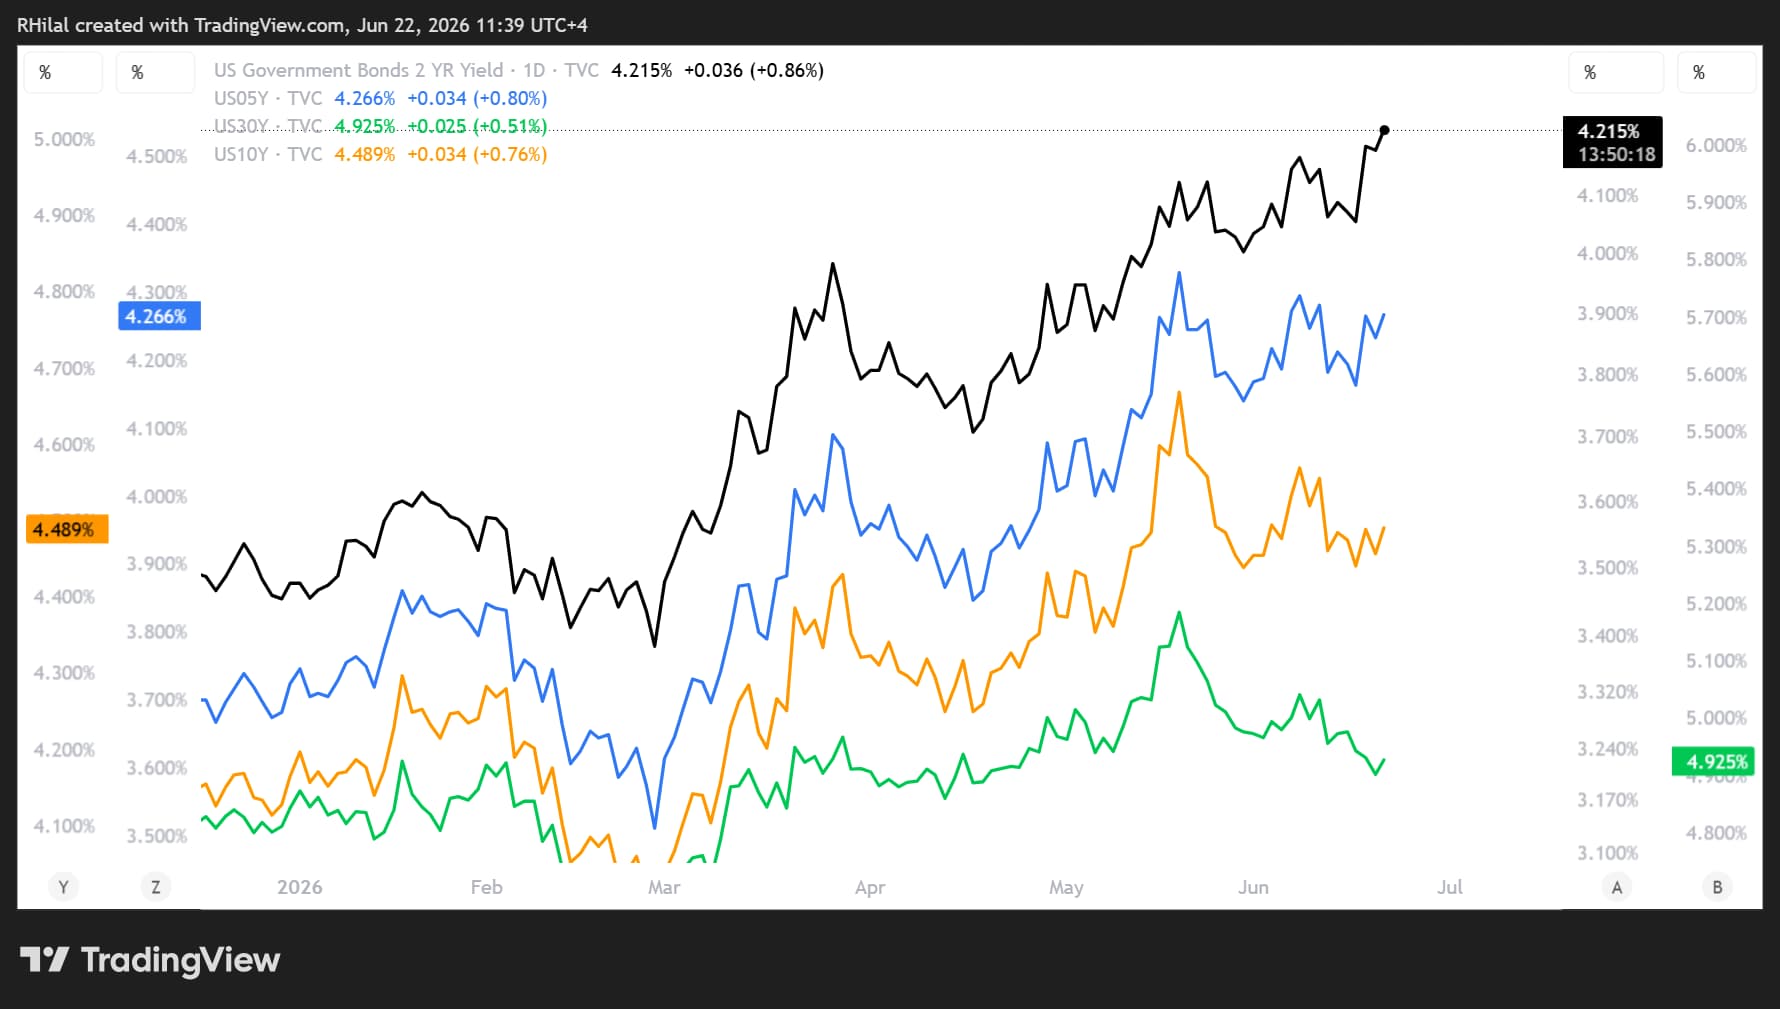
The short-term outlook for the US dollar remains constructive. However, longer-term bullish conviction will likely require a confirmed breakout above 101.20 and a continuation higher in US 10-year Treasury yields, allowing them to catch up with the strength already reflected in the 2-year Treasury market.
US02Y vs 5Y - 10Y - 30Y Yields
Source: Trading view
This setup is placing growing pressure on GBPUSD as the pair trades below its ascending support trendline from November 2025 near the yearly low at 1.3160. Meanwhile, USDJPY continues to challenge the multi-decade resistance zone near 161.30, levels that could dictate the next major move across currency markets.
I discuss these charts regularly during the Daily MENA Market Call.
Register here for the next webinar
DXY Price Outlook: Monthly Time Frame – Log Scale
Source: TradingView
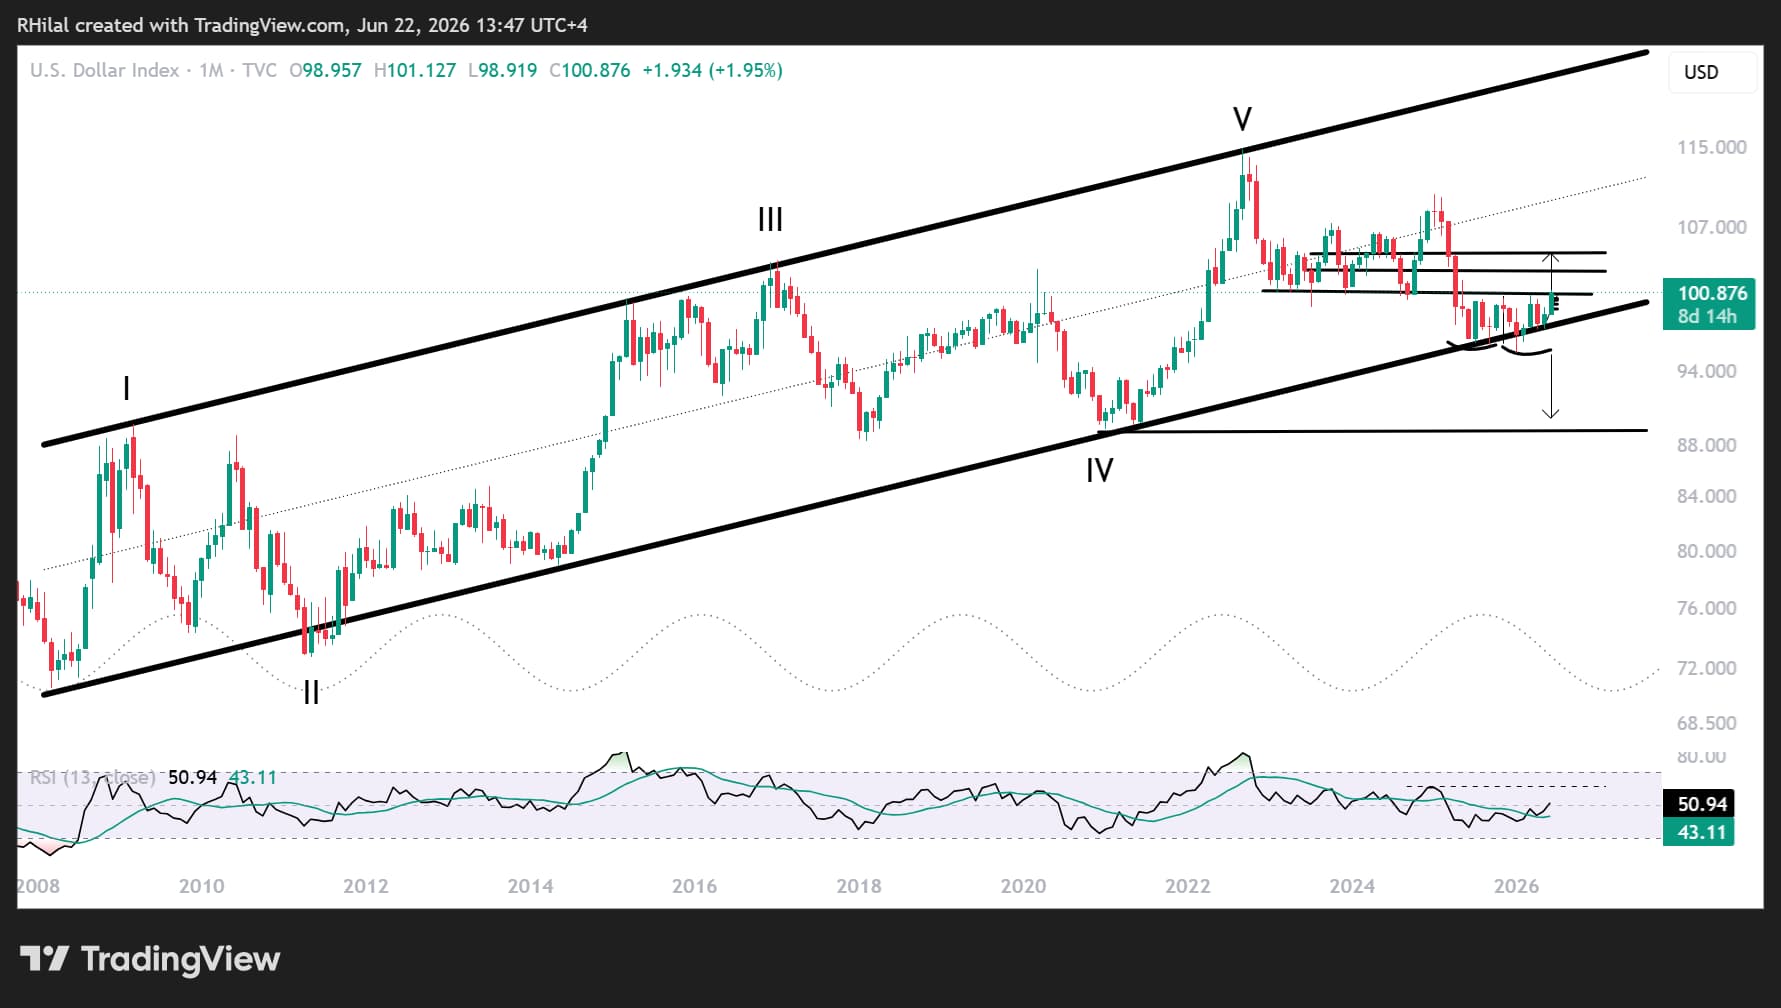
Why the 101.20 Zone Matters
As the old saying goes, the trend is your friend.
The DXY has respected a rising trend structure since 2008 and is now testing:
- A multi-year support-turned-resistance zone near 101 that has been in place since 2022.
- The 38.2% Fibonacci retracement of the decline between the 2025 high and the 2026 low.
- The potential neckline of a double-bottom formation developing throughout the past year.
A breakout above 101.20 would expose the next major Fibonacci resistance levels near:
- 102.80 (50%)
- 104.50 (61.8%)
This scenario could accelerate downside pressure on GBPUSD toward 1.29 and 1.27 while supporting a continuation higher in USDJPY toward 170 before longer-term projections toward 180 come into focus.
On the downside, DXY would need to break below 100 and then 99.30 to re-establish a bearish outlook, potentially supporting a recovery in major currencies and precious metals.
USDJPY Price Outlook: Weekly Time Frame – Log Scale
Source: TradingView
USDJPY Challenges the 160–163 Resistance Zone
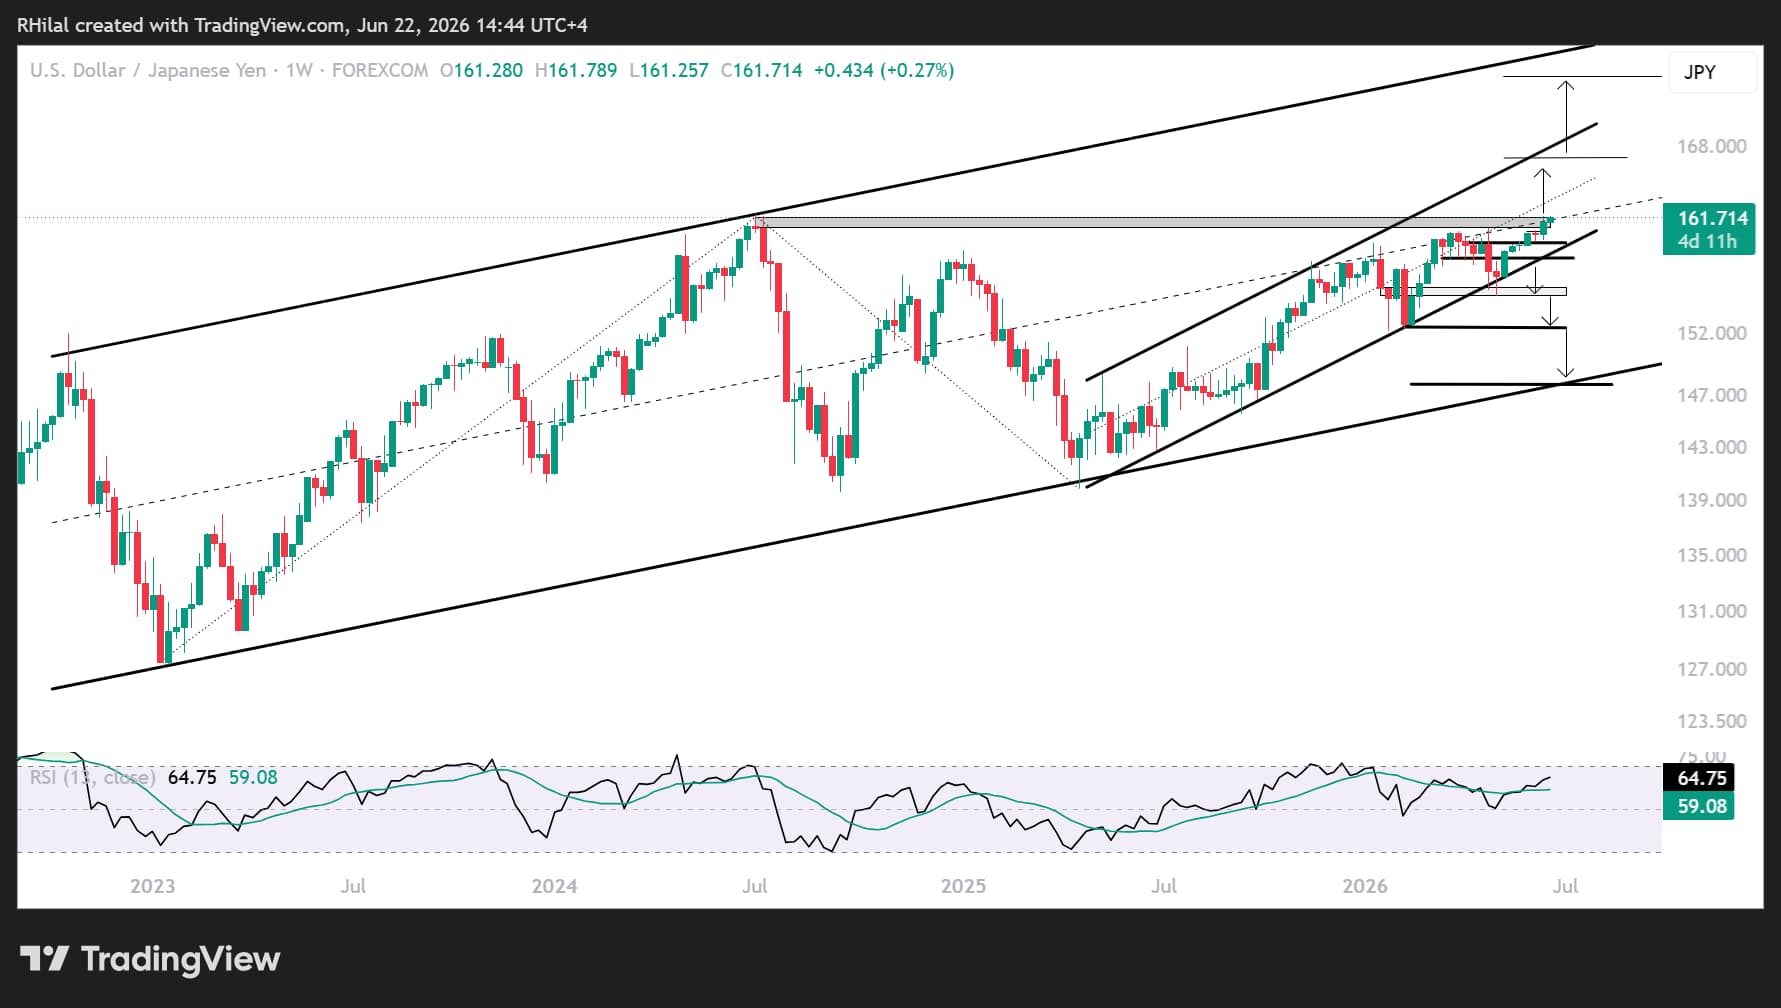
From a weekly perspective, USDJPY has maintained a bullish structure since 2022, respecting the boundaries of a long-term ascending channel while simultaneously trading within a shorter-term one-year rising channel.
These two structures continue to define the pair's directional bias.
USDJPY is now challenging the key psychological and multi-decade resistance zone between 160 and 163, a region that has repeatedly capped advances over the past several decades.
Bullish Scenario – Breakout Above 161.30
A sustained breakout above 161.30 could open the door toward 163.20, representing both the midpoint of the ascending channel and a major resistance zone that capped gains in 2024.
A successful break above this region would expose the upper boundary of the channel near:
- 166.00
- 168.00
Beyond that, longer-term projections point toward the 174–180 region, levels not seen in decades.
Such a move would represent a major continuation of the structural bull market that has driven USDJPY higher since 2022.
However, the probability of direct or verbal intervention from the Bank of Japan is likely to increase significantly as USDJPY approaches those levels.
In addition, momentum indicators are already showing signs of bearish divergence against price action, suggesting that upside momentum may begin to slow, although a renewed acceleration in momentum could invalidate those divergence signals.
Bearish Scenario – Breakdown Below 158
The lower boundary of the one-year ascending channel remains the most important support zone to monitor.
A break below 158.00 and the lower boundary of the rising channel would increase the risk of a deeper corrective move toward:
- 155.00 (previous support)
- 152.00 (yearly low)
A break below these levels would expose the long-term ascending channel support that has guided price action since 2022, currently near 147.00.
While the broader trend remains bullish, traders should remain alert to the possibility of corrective moves as the pair approaches historically significant resistance levels.
For the quarterly outlook, see my previous analysis: USDJPY Price Forecast: Could a Hawkish Fed Trigger a Breakout Toward 180?
GBPUSD Price Outlook: Weekly Time Frame – Log Scale
Source: TradingView
GBPUSD Tests a Major Breakdown Zone
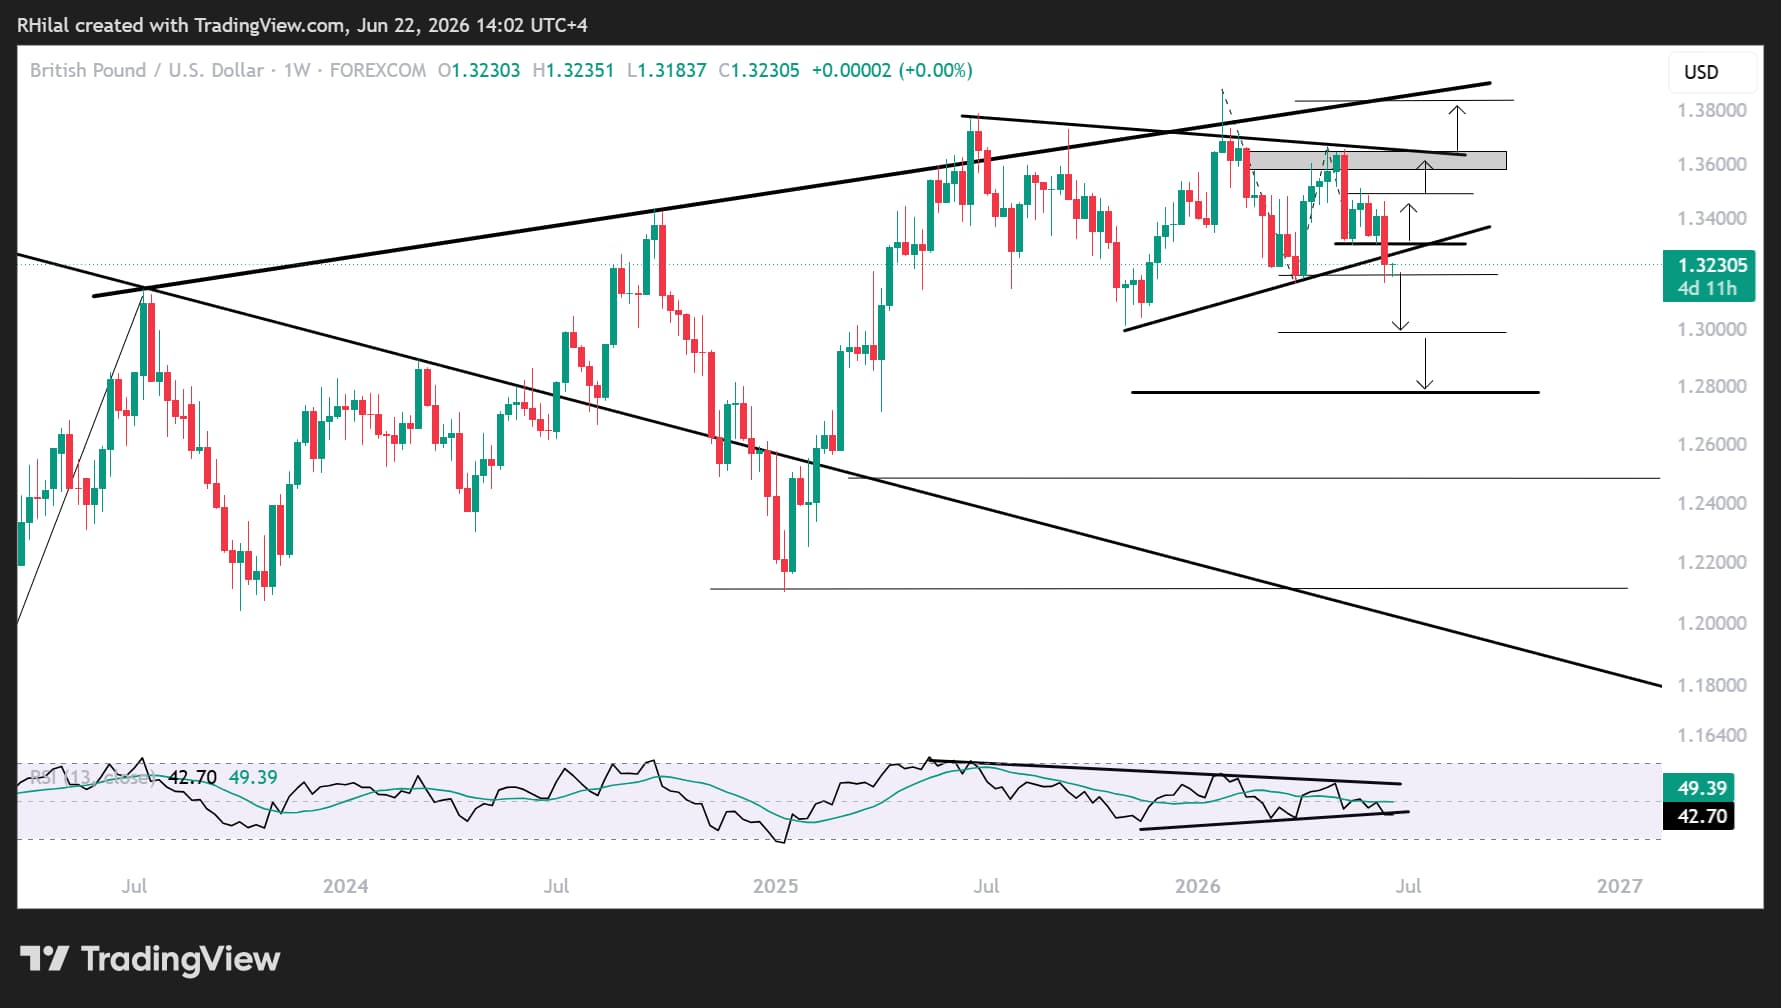
From a weekly perspective, GBPUSD is attempting to break below a year-long contracting consolidation that has been developing since June 2025. Fundamentally, political uncertainty may imply additional headwinds on the pair, following the resignation of Kier Starmer. To read more on the latest political situation: GBP/USD, EUR/USD Forecast: Two trades to watch
Price action is currently trading near the key yearly low and support zone at 1.3160.
At the same time, the weekly RSI is testing the lower boundary of its own year-long consolidation pattern, highlighting two potential scenarios.
Bearish Scenario – Breakdown Below 1.3160
A daily close below 1.3160 would increase the risk of a deeper decline toward:
- 1.2990 (50%)
- 1.2780 (61.8%)
These levels align with key Fibonacci retracement levels of the broader advance of 2025 low - 2026 high. The 1.2780–1.2790 region may represent the highest-probability area for a rebound, particularly if weekly momentum indicators enter oversold territory not seen since 2025.
Bullish Scenario – Reclaiming 1.33
A close back above 1.33 would shift attention toward:
- 1.3500 (the midpoint of the consolidation range)
- 1.3640 (the upper boundary of the consolidation)
A breakout above 1.3640 would expose the descending trendline connecting major highs since 2023 near 1.3830 before opening the door toward the psychological 1.40 level.
DXY Remains the Key Driver
For now, the US Dollar Index remains the key driver for both USDJPY and GBPUSD.
A confirmed breakout above 101.20 could reinforce the bullish dollar narrative and accelerate moves toward the downside targets discussed in GBPUSD while supporting further gains in USDJPY.
Conversely, a rejection from current levels may provide temporary relief for major currencies and delay the next directional move.
With US02Y Treasury yields rising and the dollar approaching a critical technical inflection point, the next move in DXY may determine whether these currency pairs continue their current trends or enter a broader consolidation phase.
Written by Razan Hilal, CMT
Follow on X: @Rh_waves
Related tags:







Web Trader platform
Our sophisticated web-based platform is packed with features.
Open an account today
Experience award-winning platforms with fast and secure execution.
Economic calendar
Related articles

Canadian Dollar Forecast: USD/CAD Weekly Reversal Puts Yearly Uptrend Back in Focus 8 29 2026
USD/CAD has staged its strongest weekly advance since June, shifting the focus to whether a more durable low is finally taking shape.


USD/JPY weekly outlook: Payrolls may challenge the Fed’s hawkish reset
USD/JPY has finally woken from its slumber. Payrolls now loom as the key test of whether the latest hawkish repricing sticks or sinks.


Euro Short-term Outlook: EUR/USD Pullback Nears Pivotal Uptrend Support 8 28 2026
Warsh's comments accelerated the EUR/USD selloff, raising the stakes as buyers look to stabilize the broader recovery.