


USDJPY Price Forecast: Could a Hawkish Fed Trigger a Breakout Toward 180?
USDJPY Price Forecast: A hawkish Fed and stronger DXY keep pressure on the yen as USDJPY stabilizes near the critical 160 resistance zone, with 180 emerging as a long-term target.
Written by
Razan Hilal
Market Analyst
A hawkish Federal Reserve continues to support the bullish outlook for USDJPY as the pair stabilizes near the critical 160 resistance zone. A confirmed breakout above this multi decade resistance could expose the 180 target, although the probability of Bank of Japan intervention may increase significantly at higher levels.
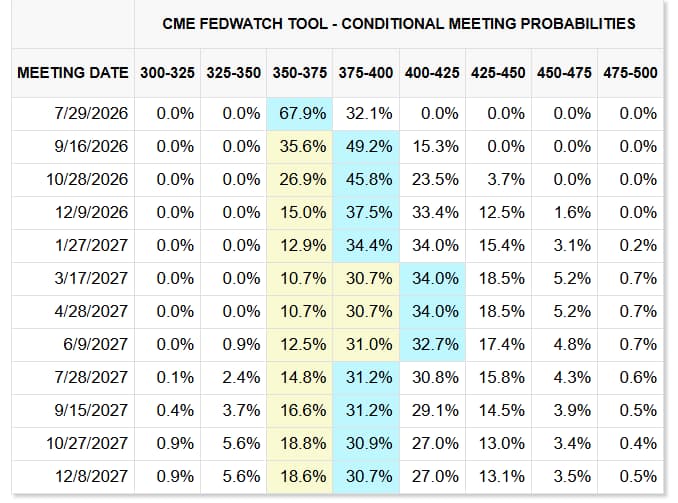
Kevin Warsh's first FOMC meeting reinforced expectations of a more hawkish policy stance, with Fed Funds futures continuing to price in the possibility of a rate hike by September, with odds rising to 49%, according to the CME FedWatch Tool.
Source: CME
DXY Retests a Critical Multi-Year Zone
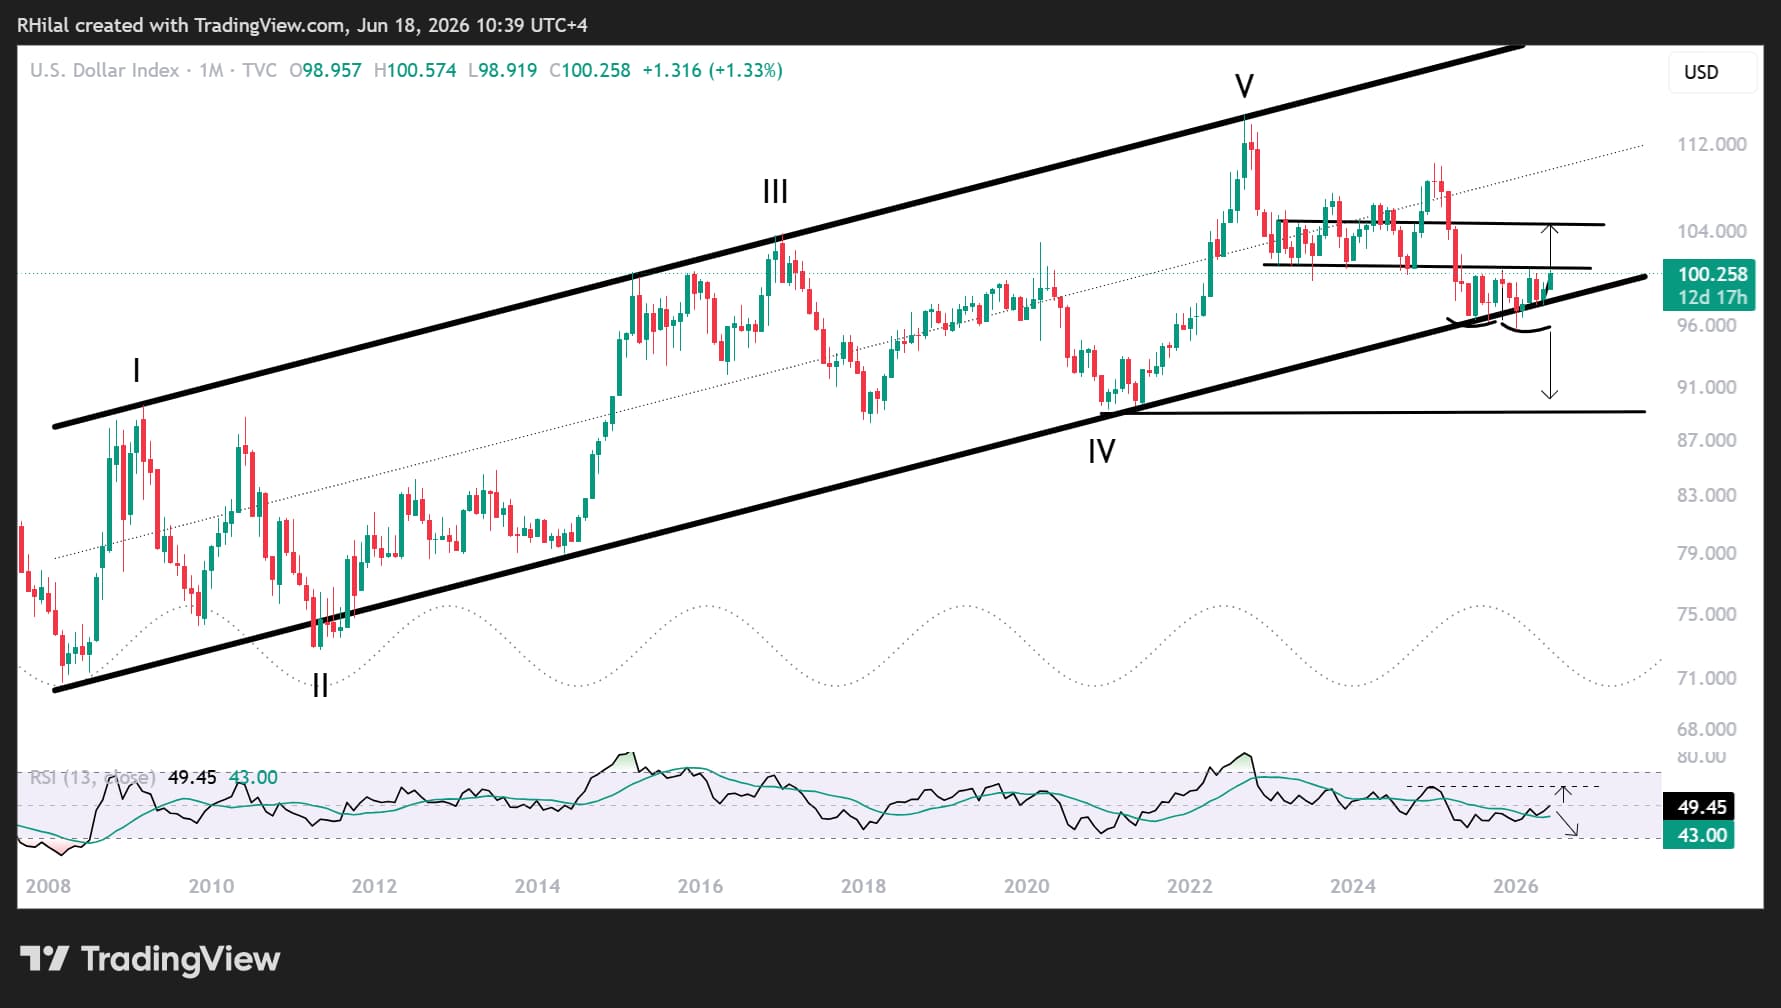
As a result, the US Dollar Index (DXY) continues to hold above multiple layers of technical support, as discussed in my previous analysis. DXY, Gold Price Forecast: Will Kevin Warsh's First FOMC Halt or Support Gold's Rebound?
The index is now retesting the critical multi-year pivot zone between 100.60 and 100.80, an area that could determine the next major move in both the dollar and USDJPY.
DXY Price Forecast: Monthly Time Frame – Log Scale
Source: TradingView
Why the 100.60–100.80 Zone Matters
The primary bias on the DXY remains bullish unless price action breaks below the key support levels at 98, 97, and 95.
However, if DXY maintains its bullish structure and reclaims the multi-year pivot zone between 100.60 and 100.80, a stronger bullish breakout could emerge, potentially increasing pressure on major currencies while weighing on precious metals.
A sustained move above this zone would reinforce the case for a stronger dollar heading into the second half of the year, particularly if the FOMC maintains a hawkish tone and Kevin Warsh emphasizes the Federal Reserve's independence.
I discuss these levels regularly during my Daily MENA Market Call.
USDJPY Price Forecast: Weekly Time Frame – Log Scale

Source: TradingView
USDJPY Challenges the 160–163 Resistance Zone
From a weekly perspective, USDJPY has maintained a bullish structure since 2022, respecting the boundaries of a long-term ascending channel while simultaneously trading within a shorter-term one-year rising channel.
These two structures continue to define the pair's directional bias.
USDJPY is now challenging the key psychological and multi-decade resistance zone between 160 and 163, a region that has repeatedly capped advances over the past several decades.
Bullish Scenario – Breakout Above 161.30
A sustained breakout above 161.30 could open the door toward 163.20, representing both the midpoint of the ascending channel and a major resistance zone that capped gains in 2024.
A successful break above this region would expose the upper boundary of the channel near:
- 166.00
- 168.00
Beyond that, longer-term projections point toward the 174–180 region, levels not seen in decades.
Such a move would represent a major continuation of the structural bull market that has driven USDJPY higher since 2022.
However, the probability of direct or verbal intervention from the Bank of Japan is likely to increase significantly as USDJPY approaches those levels.
In addition, momentum indicators are already showing signs of bearish divergence against price action, suggesting that upside momentum may begin to slow, unless the readings point higher.
Bearish Scenario – Breakdown Below 158
The lower boundary of the one-year ascending channel remains the most important support zone to monitor.
A break below 158.00 and the lower boundary of the rising channel would increase the risk of a deeper corrective move toward:
- 155.00 - previous support
- 152.00 - yearly low
A break below these levels would expose the long-term ascending channel support that has guided price action since 2022, currently near 147.00.
While the broader trend remains bullish, traders should remain alert to the possibility of corrective moves as the pair approaches historically significant resistance levels.
USDJPY Price Forecast: 3-Month Time Frame – Log Scale
Source: TradingView
Why the 160 Zone Is Historically Significant
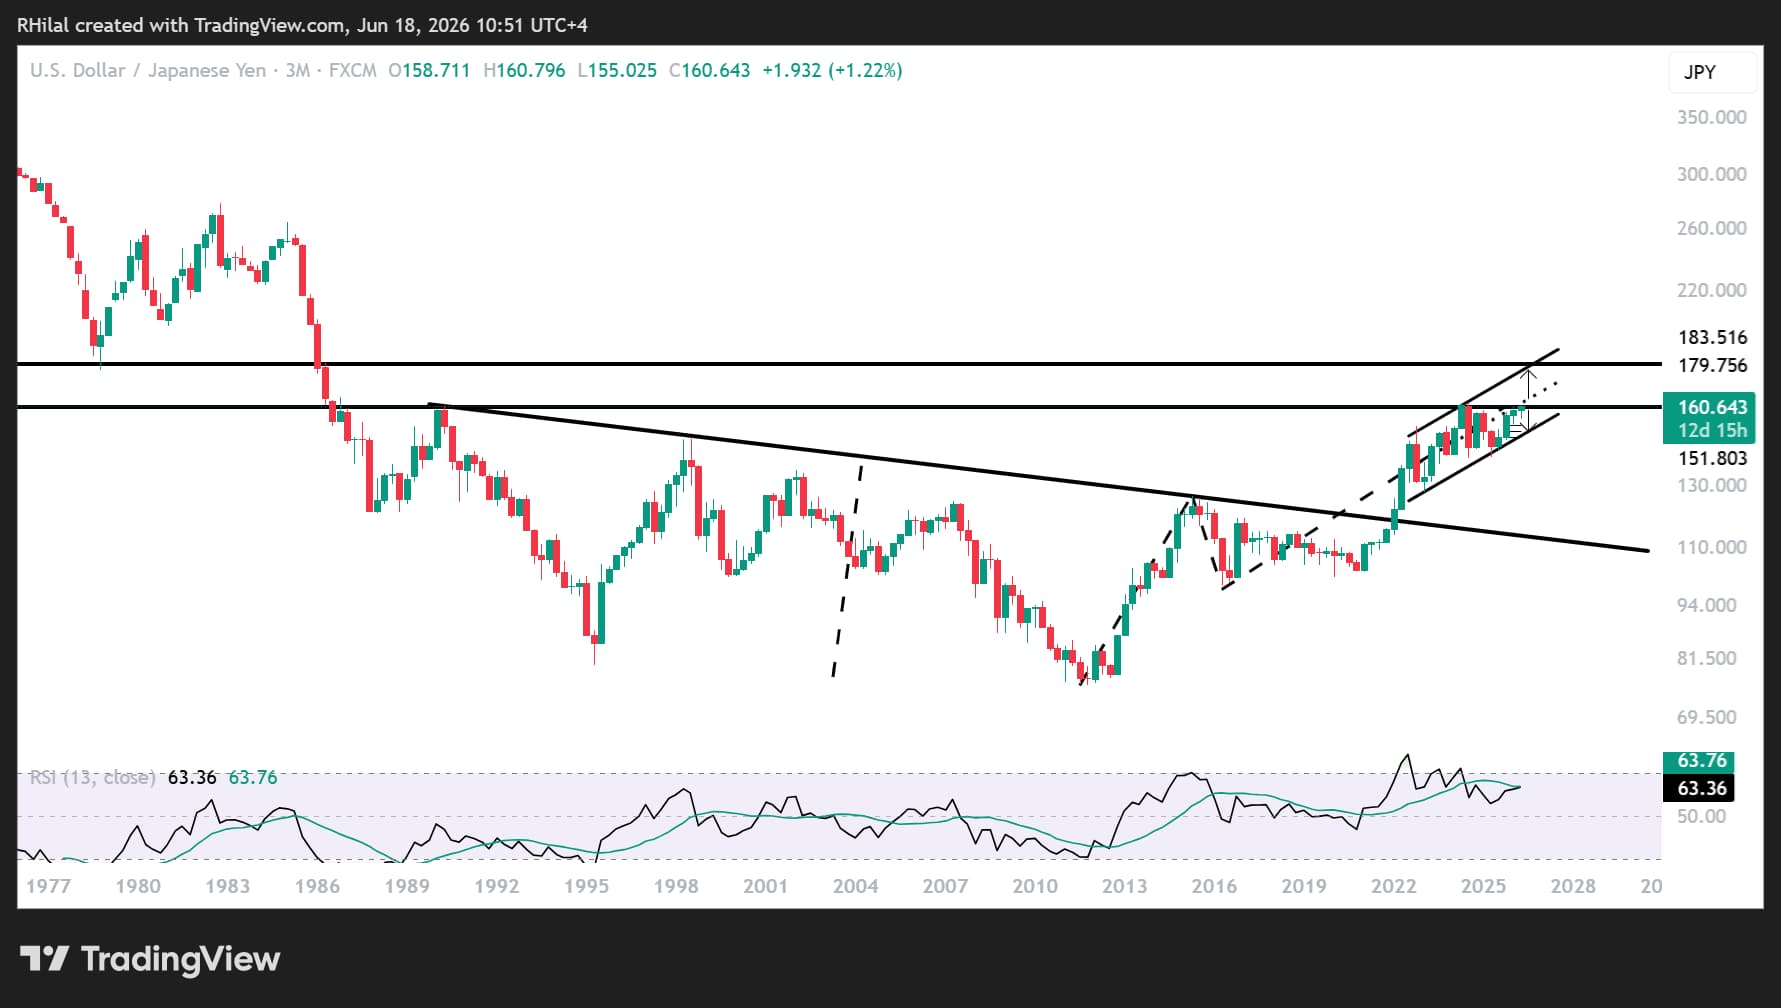
From a three-month perspective, the 160 zone aligns closely with resistance levels originating from the highs of the 1990s.
This longer-term perspective highlights the significance of a potential breakout above 160 and reinforces the broader bullish implications of a move beyond the 2024 highs.
Unlike shorter-term charts, the quarterly timeframe places the current rally within a multi-decade context and demonstrates how significant a breakout beyond this region would be.
Could USDJPY Reach 180?
A confirmed breakout above the 160–163 resistance zone could eventually expose the former support zone from the early 1980s near 180.
This area may now act as a major long-term target and resistance level before another meaningful correction develops.
While such projections remain longer-term in nature, they illustrate the scale of the opportunity available if dollar strength continues to dominate global currency markets.
DXY Remains the Key Driver
For now, the technical outlook remains closely tied to the direction of the US Dollar Index.
As long as DXY maintains its bullish structure above key support levels, the probability of a USDJPY breakout above 160 remains elevated.
However, traders should remain mindful of increasing BOJ intervention risks as the pair approaches multi-decade resistance levels.
The battle between a hawkish Federal Reserve and a cautious Bank of Japan may ultimately determine whether USDJPY merely retests historical highs or begins a new leg higher toward the 180 region.
Written by Razan Hilal, CMT
Follow on X: @Rh_waves
Related tags:







Web Trader platform
Our sophisticated web-based platform is packed with features.
Open an account today
Experience award-winning platforms with fast and secure execution.
Economic calendar
Related articles

Euro Short-term Outlook: EUR/USD Pullback Nears Pivotal Uptrend Support 8 28 2026
Warsh's comments accelerated the EUR/USD selloff, raising the stakes as buyers look to stabilize the broader recovery.


AUD/CAD breakout puts the Bradman barrier in sight
A bullish breakout has pushed AUD/CAD to its highest level since early 2021. Whether it can clear 0.9994 may determine if the move extends well above parity.


Australian Dollar Forecast: AUD/USD Breakout Rally Nears Pivotal Resistance 8 27 2026
Aussie has advanced in eight of the past nine weeks, but the next technical hurdle could determine whether bulls can sustain the broader advance.