


ASX 200 Futures Reversal Patterns Put to the Test
Not all reversal patterns are created equal. Historical ASX 200 futures data shows which signals have been more reliable, and why risk management still matters.
Written by
David Scutt
Market Analyst
- Bullish reversal patterns deliver stronger hit rates
- Bullish engulfing stood out across 37 signals
- Historical extremes underline need for risk management
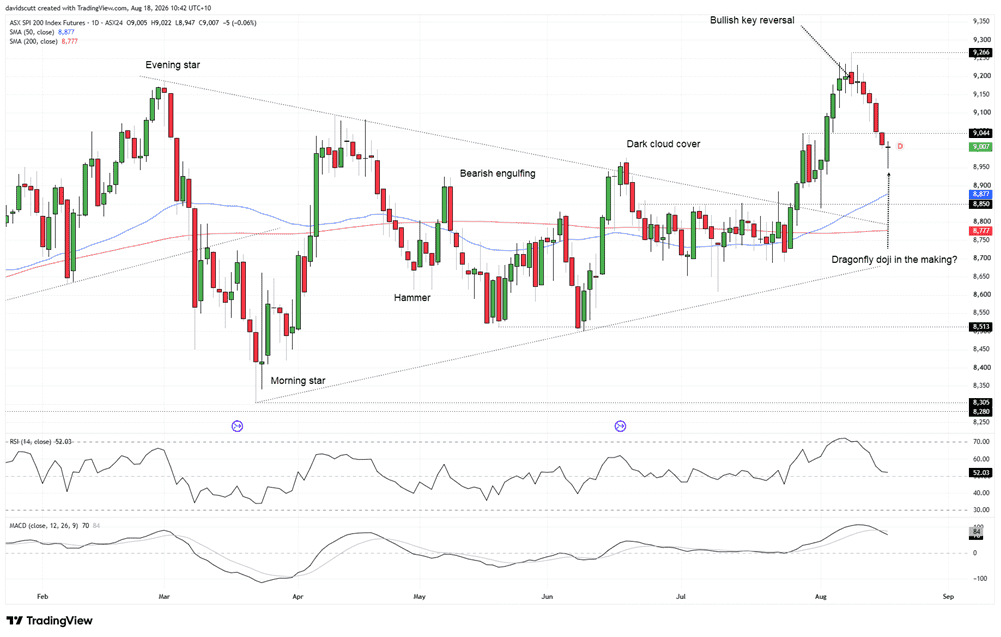
The Australian SPI futures daily chart has thrown up several obvious reversal patterns around important turning points this year, including a bearish key reversal near the recent record high that preceded the latest leg lower.
Looking back, there are plenty of other examples where reversal patterns appear to have provided at least some warning that the prevailing move was running out of steam.
That piqued my interest. Rather than simply assuming these textbook patterns work, I wanted to know which daily reversal signals in the contract have been more reliable over time, which ones have produced useful follow-through, and which probably deserve a sizeable asterisk against them.
The question is particularly relevant right now following the bearish move from the record highs set earlier this month, with Tuesday’s unfinished candle threatening to form a dragonfly doji, another potential reversal pattern if it survives into the close.
How the signals qualified
Source: LSEG, FOREX.com
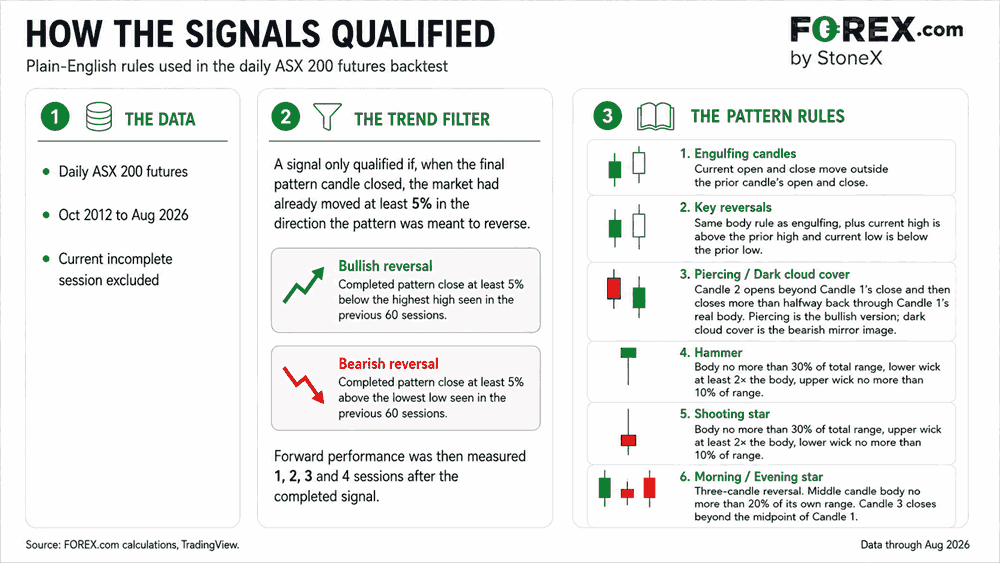
Looking back to late 2012, I set clear mechanical definitions for each reversal pattern before testing how they performed.
To qualify, a reversal pattern had to form after the market had already moved at least 5% in the opposite direction to the signal, measured against the actual high or low reached within the preceding 60 trading sessions.
Once the pattern was complete, I then measured how SPI futures performed over the following one, two, three and four sessions.
What the results showed
Source: LSEG, FOREX.com
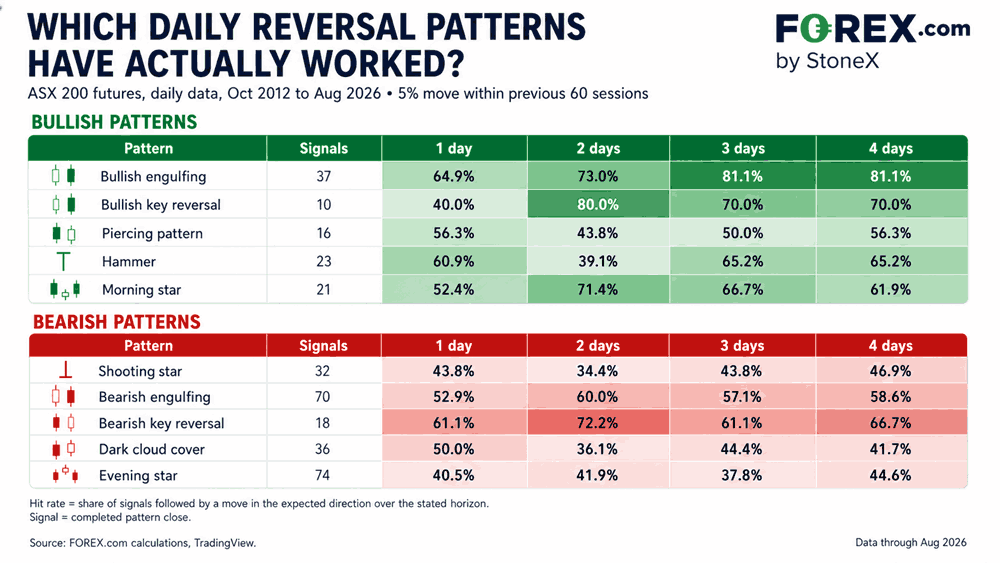
The overall assessment was that bullish reversal patterns generally had the stronger hit rates.
Bullish engulfing was the standout, with a relatively large sample of 37 signals and a hit rate that progressively improved over the following sessions. Bullish key reversals also performed well, despite a patchier track record on day one, with the signal tending to correctly anticipate the prevailing move over the following two to four sessions.
In contrast, bearish reversal patterns were generally less reliable, despite having larger sample sizes to work with in several cases. Of those that did show a more consistent edge, bearish key reversals stood out, recording the highest hit rate over the following two sessions.
For this study, the hit rate simply measures how often the signal correctly anticipated the prevailing move over the subsequent one, two, three and four-session periods from the close when the signal was triggered.
What the stronger signals delivered
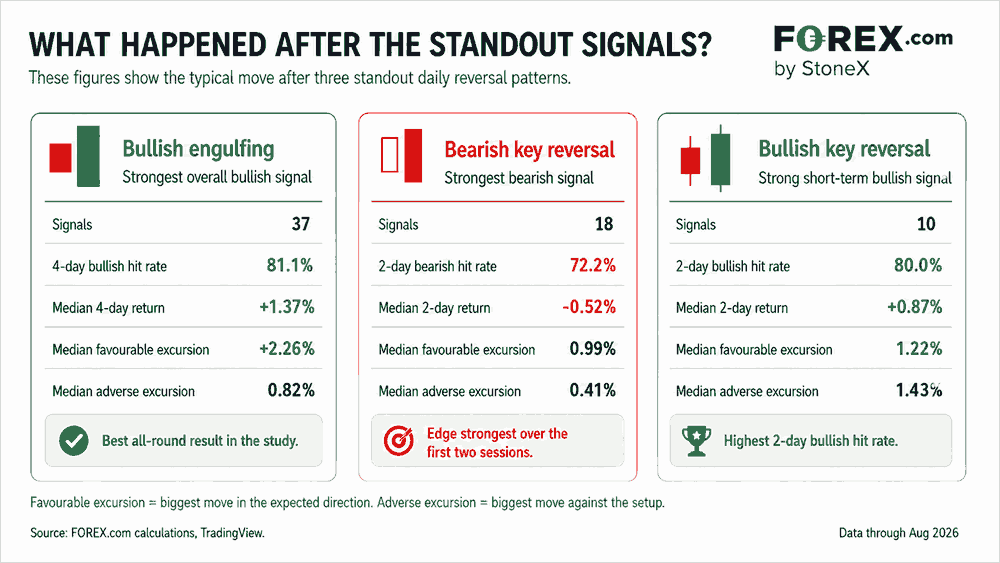
Of those that recorded the higher hit rates, I then looked at the median return generated by each signal, along with the median favourable and adverse excursion.
Put simply, favourable excursion measures the median move in the direction the signal indicated from the close when it was triggered, while adverse excursion measures the median move against the signal over the same period.
Source: LSEG, FOREX.com
Bullish engulfing again stood out. Across 37 qualifying signals, the median four-session return was 1.37%, with a median favourable excursion of 2.26% compared with a median adverse excursion of 0.82%. The most extreme outcomes were much wider, with a maximum favourable excursion of 5.35% and a maximum adverse excursion of 10.65%.
Bearish key reversals also performed well over the following two sessions. Across 18 signals, the median two-session return was -0.52%, with a median favourable excursion of 0.99% and median adverse excursion of 0.41%. The maximum favourable and adverse excursions were 3.84% and 2.28% respectively.
Bullish key reversals also had a strong hit rate over the following two sessions. Across 10 qualifying signals, the median two-session return was 0.87%, although the path was less convincing, with a median favourable excursion of 1.22% compared with a slightly larger median adverse excursion of 1.43%. The maximum favourable excursion was 3.77%, while the maximum adverse excursion reached 3.37%.
The results reinforce that hit rate alone only tells part of the story. Even the more reliable signals can experience meaningful moves against them, with the extremes considerably larger than the typical outcome. That emphasises the need for risk management when trading off chart patterns.
Another possible reversal signal emerging?
Source: TradingView
Should the potential dragonfly doji be maintained into the close, or morph into a hammer, it would put emphasis on levels overhead, the first of which is 9,044, a level that has repeatedly come into play over the past month.
A move back above that level would put a potential retest of the record high at 9,266 in play. If that were to eventuate, longs could be set above 9,044 with a stop beneath for protection, targeting the record highs.
Of course, if 9,044 were to hold, it would open the door for bearish trades looking for an extension of the prevailing bearish move. Shorts could be set beneath the level with a tight stop above, targeting 8,950, where the price stalled in the overnight session on Monday. Beyond that, the 50-day simple moving average and 8,850 come into view, the latter having acted as resistance before flipping to support in late July.
Upside momentum has faded rapidly over the past week, although there is tentative evidence emerging that trend may now be stalling, with RSI (14) back above the neutral 50 level. While not yet confirmed by MACD, which has staged a bearish crossover, it remains in bullish territory.
The overall message from the oscillators is more a cautious one for bulls rather than a green light for bears, placing more emphasis on price action when assessing directional risks.
Latest market news










Web Trader platform
Our sophisticated web-based platform is packed with features.
Open an account today
Experience award-winning platforms with fast and secure execution.
Economic calendar
Related articles

Gold and S&P 500 analysis: What now after Warsh’s hawkish speech?
The dollar surged across the board after the Fed Chair Kevin Warsh surprised with a hawkish-leaning speech at the Jackson Hole summit. All the bearish dollar bets that had been accumulated since last Friday on the back of data weakness and bond market troubles had to be squared and that triggered a short squeeze rally for the dollar. Gold and silver dropped, as a result, as too did bitcoin, while US indices were giving back earlier gains.


EUR/USD forecast: All eyes on Warsh at Jackson Hole - Forex Friday
For much of this week, the EUR/USD has been edging lower with the US dollar regaining some ground after last week’s sell-off that was triggered, in part, by the bond market worries. Investors have been unwilling to bet further against the US dollar so far this week ahead of Kevin Warsh’s keynote speech at the Jackson Hole summit, due later today.

Bitcoin Forecast: BTC/USD Back to $80K Ahead of Warsh’s Jackson Hole Speech
After surging over $15,000 in the past 10 days alone, there is risk of a near-term pullback if Warsh says anything remotely hawkish at Jackson Hole - what are the levels to watch from here?
