


ASX 200 Morning Market Outlook: Post-Selloff Rebound Looks Fragile
ASX 200 futures hint at a soft rebound after Monday’s tariff-driven selloff, with volatility elevated and traders watching key support near 8,866.
Written by
Matt Simpson
Market Analyst
The ASX 200 looks set for a tentative rebound after Monday’s tariff-driven selloff left risk sentiment bruised. While Wall Street futures managed to recover overnight, the muted response from SPI 200 futures suggests local traders remain cautious. With volatility spiking to multi-week highs and sector breadth soft, any rebound may prove short-lived unless fresh catalysts emerge.
View related analysis:
ASX 200 Rebound Faces Resistance After Trump-Tariff Shock
ASX 200 Market Snapshot
- Monday’s Trump-tariff induced selloff was the most bearish session for the ASX 200 cash market in 13 days at -0.84%, and most volatile in 7 days (1%)
- 10 of the 11 ASX 200 sectors declined, led by Technology (XJT -2%) and Financials (XFJ -1.22%)
- Implied volatility spiked to a 6-week high, although with realised volatility greatly reduced overnight then this seems likely to be an outdated warning for the ASX today
- While Wall Street futures rose on Monday, ASX futures (SPI 200) were not as enthusiastic – which points to a weak rebound today
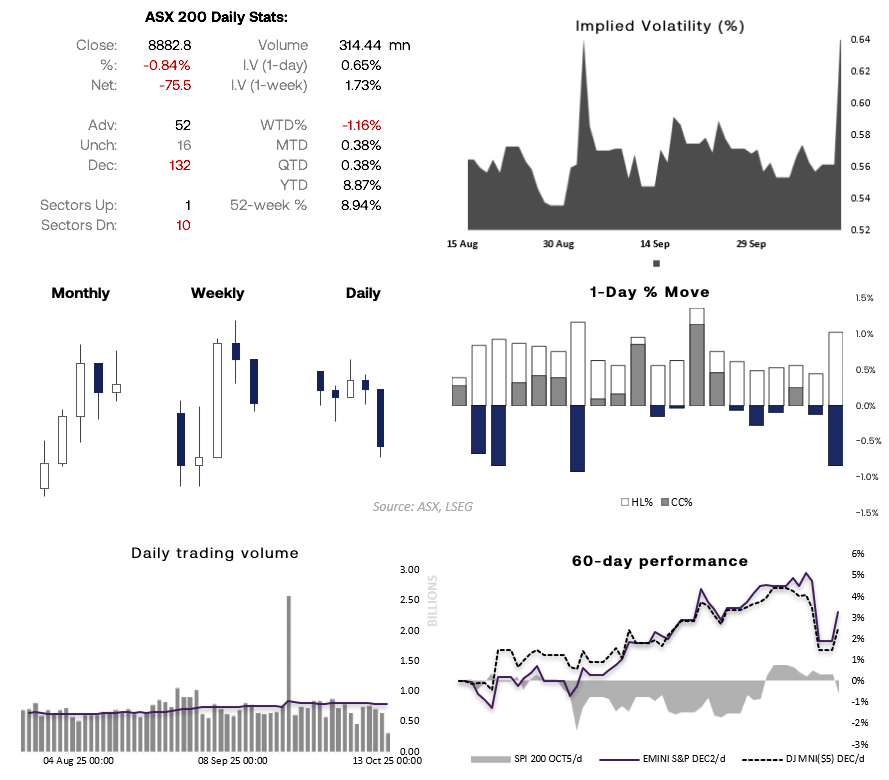
Chart analysis by Matt Simpson - data source: ASX, LSEG
ASX 200 Technical Analysis
Prices have fallen back within September’s trading range after last Monday’s shooting star reversal marked a false break above the previous record high. With volatility increasing around the 8,900 area, it seems likely that bears may retain the upper hand before the ASX 200 goes on to retest those highs.
I noted last week that while sector performance from financials and materials remains supportive of the broader index overall, near-term bearish signals from several smaller sectors could make for choppy trade in the interim. However, if the two dominant sectors start to falter, it would point to a deeper correction for ASX 200 traders.

The daily RSI (2) reached oversold territory on Friday, yet the supposed rebound in ASX futures barely registered compared with Wall Street indices. This suggests the market is not yet ready for a meaningful recovery without a fresh catalyst and likely favours the bears until a solid low is established.
The 4-hour chart shows that ASX futures found near-term support around 8900 and momentum is curling higher. Perhaps we’ll see another pop higher after the open, but I am on guard for a swing high to form and for prices to head towards the weekly S2 pivot (8866). A break beneath the 8839 low assumes risk-off has returned, and ASX bears could eye the September low at 8752.
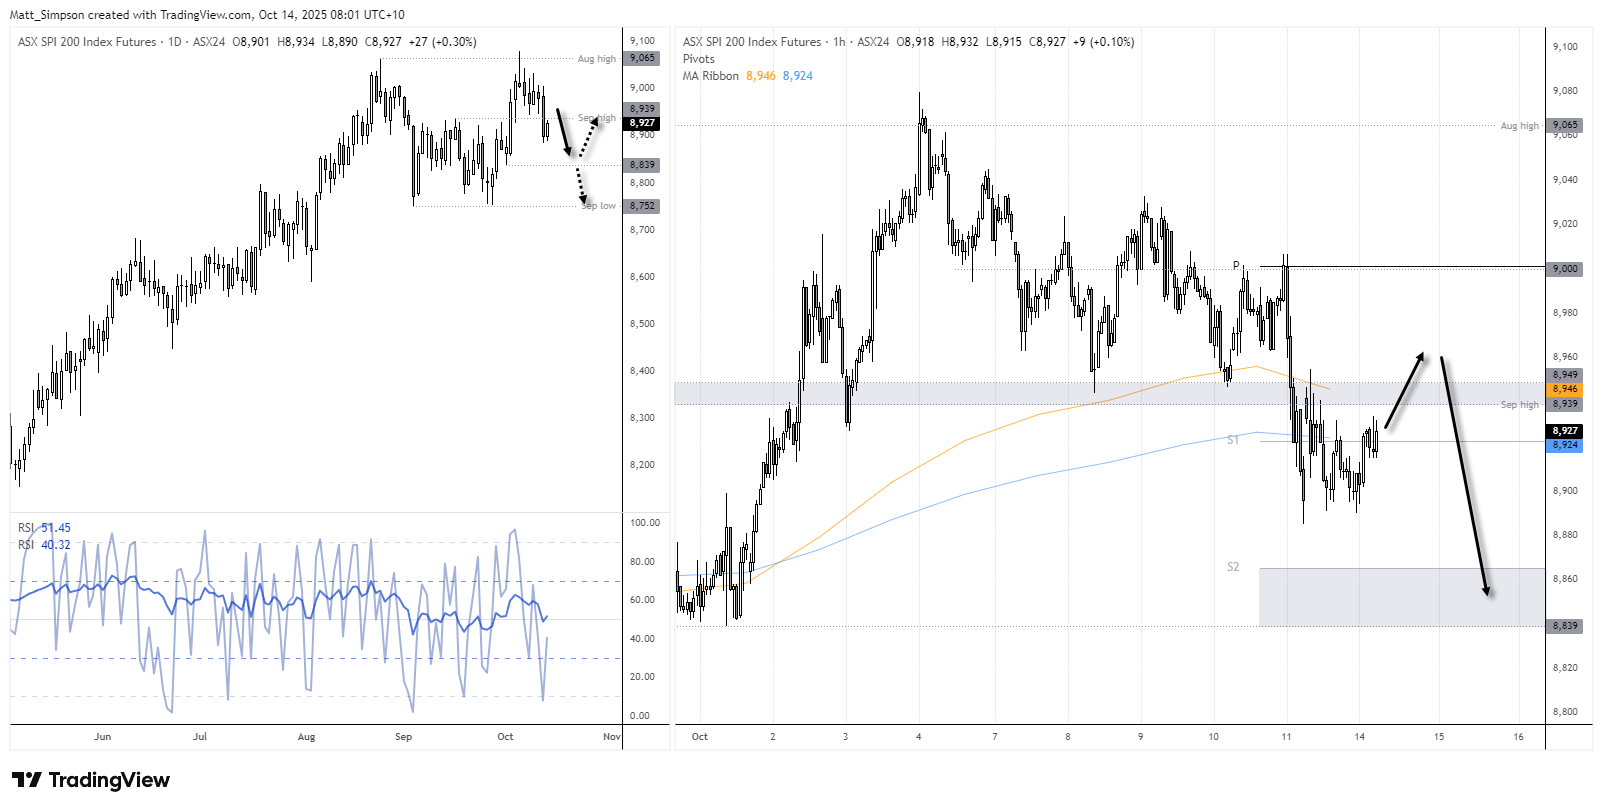
Chart analysis by Matt Simpson - Source: TradingView, ASX SPI 200 Index Futures
View the full economic calendar
-- Written by Matt Simpson
Follow Matt on Twitter @cLeverEdge
How to trade with City Index
You can trade with City Index by following these four easy steps:
- Open an account, or log in if you’re already a customer
• Open an account in the UK
• Open an account in Australia
• Open an account in Singapore
- Search for the market you want to trade in our award-winning platform
- Choose your position and size, and your stop and limit levels
- Place the trade
Related tags:







Web Trader platform
Our sophisticated web-based platform is packed with features.
Open an account today
Experience award-winning platforms with fast and secure execution.
Economic calendar
Related articles

Euro Short-term Outlook: EUR/USD Pullback Nears Pivotal Uptrend Support 8 28 2026
Warsh's comments accelerated the EUR/USD selloff, raising the stakes as buyers look to stabilize the broader recovery.


Gold and S&P 500 analysis: What now after Warsh’s hawkish speech?
The dollar surged across the board after the Fed Chair Kevin Warsh surprised with a hawkish-leaning speech at the Jackson Hole summit. All the bearish dollar bets that had been accumulated since last Friday on the back of data weakness and bond market troubles had to be squared and that triggered a short squeeze rally for the dollar. Gold and silver dropped, as a result, as too did bitcoin, while US indices were giving back earlier gains.


EUR/USD forecast: All eyes on Warsh at Jackson Hole - Forex Friday
For much of this week, the EUR/USD has been edging lower with the US dollar regaining some ground after last week’s sell-off that was triggered, in part, by the bond market worries. Investors have been unwilling to bet further against the US dollar so far this week ahead of Kevin Warsh’s keynote speech at the Jackson Hole summit, due later today.