


ASX 200 Outlook: Futures Signal Bearish Correction After 9000 Rejection
ASX 200 futures pull back from 9000 after a shooting star reversal, with technicals hinting at a corrective wave lower.
Written by
Matt Simpson
Market Analyst
The ASX 200 futures briefly touched the 9000 milestone last week before reversing sharply, raising the prospect of a corrective wave lower. A shooting star candle on the daily chart marked a near-term top, and while the longer-term trend remains bullish, technical signals suggest the correction may not be finished. Bears are eyeing key Fibonacci levels and moving averages as potential downside targets, while the hourly chart shows intraday weakness around the weekly pivot.
ASX 200 Futures: Technical Signals Point to Extended Correction
ASX 200 Futures (SPI 200) Technical Analysis – Daily Chart
Australia’s share market briefly touched my 9000 target last Monday before retreating. The shooting star reversal candle marked a classic near-term top and triggered a minor pullback. The daily chart trend remains strongly bullish overall, but I’m not convinced the correction has run its course. It’s not uncommon to see at least three minor corrective waves, even within a strong trend like the ASX 200.
Although we’ve seen a two-day bounce from the 10-day EMA, the bearish engulfing candle that formed overnight on ASX 200 futures is notable. It stalled near the 61.8% Fibonacci retracement, suggesting a potential lower high and the completion of wave ‘B’ in a simple ABC correction. If risk appetite weakens, a move down to the 8778 high-volume node (HVN) looks possible.
- The near-term bias remains bearish beneath the overnight high.
- A 38.2% Fibonacci level at 8833 could provide support for wave C.
- A break beneath the 10-day EMA (8911) would put the 20-day EMA (8857) and 8833 low firmly in focus.
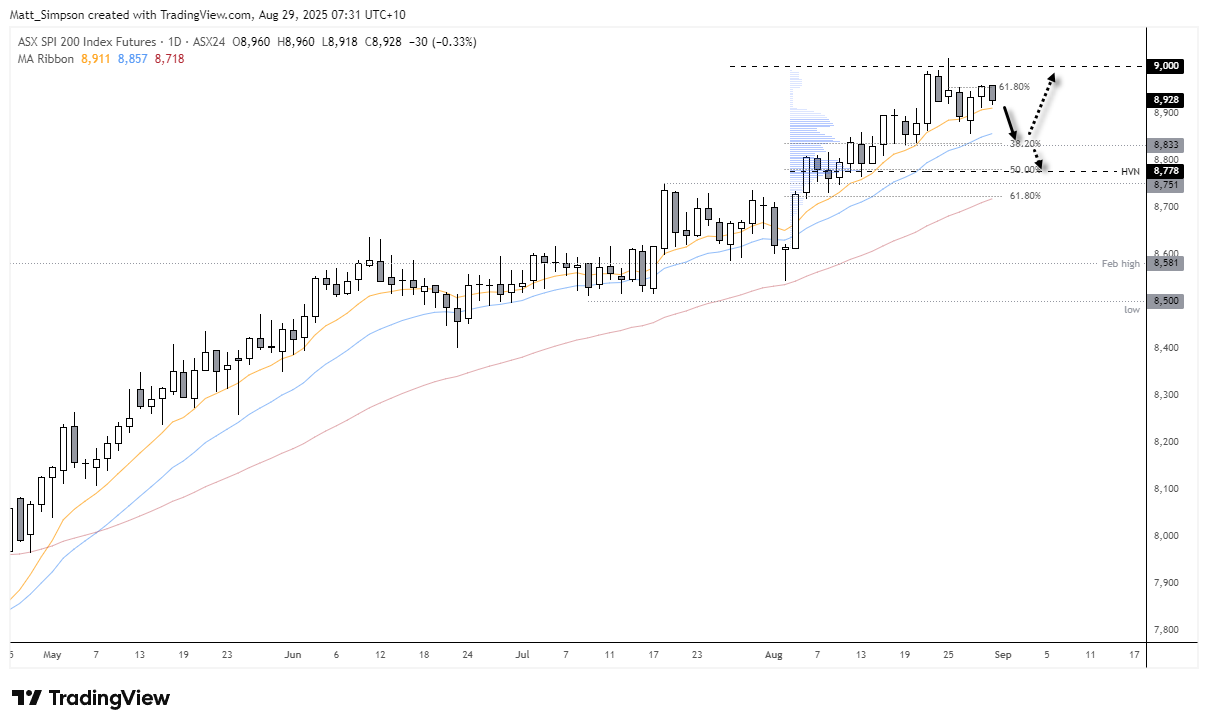
Chart analysis by Matt Simpson - Source: TradingView, ASX SPI 200 Index Futures
ASX 200 Futures (SPI 200) Technical Analysis – 1-Hour Chart
The hourly chart shows prices holding at the weekly pivot point, which could spark a minor bounce after the open. That said, the false break above 8949 and subsequent reversal near the 61.8% Fibonacci retracement suggests the ASX 200 may have topped in the near term. Any rebounds are therefore likely to favour bears seeking opportunities to fade strength.
A weekly volume point of control (VPOC) sits at 8876, providing a potential downside target if ASX futures break below 8900 today.
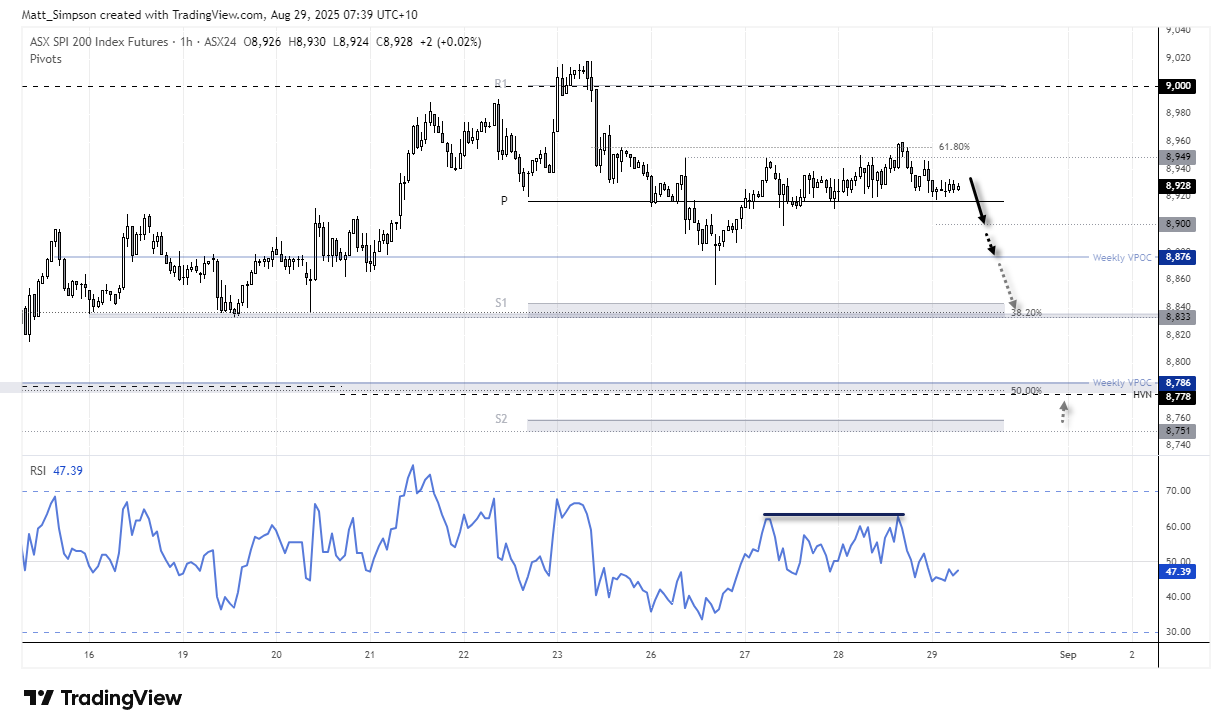
Chart analysis by Matt Simpson - Source: TradingView, ASX SPI 200 Index Futures
Key Economic Events for Traders (AEST / GMT+10)
09:30 JPY CPI, Jobs/Applications Ratio, Tokyo Core CPI, Tokyo CPI, CPI Tokyo Ex Food and Energy, Unemployment Rate (Jul/Aug) (USD/JPY, EUR/JPY, Nikkei 225)
09:50 JPY Industrial Production, Industrial Production Forecast 1m Ahead, Industrial Production Forecast 2m Ahead, Large Retailers' Sales, Large Scale Retail Sales, Retail Sales (Jul–Sep) (USD/JPY, EUR/JPY, Nikkei 225)
11:30 AUD Housing Credit, Private Sector Credit (Jul) (AUD/USD, AUD/JPY, ASX 200)
13:00 NZD M3 Money Supply (Jul) (NZD/USD, AUD/NZD, NZD/JPY)
15:00 JPY Construction Orders, Household Confidence, Housing Starts (Jul/Aug) (USD/JPY, EUR/JPY, Nikkei 225)
16:00 EUR German Import Price Index, German Retail Sales (Jul) (EUR/USD, EUR/JPY, DAX)
17:55 EUR German Unemployment Change, German Unemployment Rate, German Unemployment, German Unemployment (Aug) (EUR/USD, EUR/GBP, DAX)
18:00 EUR Regional CPIs – Baden Wuerttemberg, Bavaria, Brandenburg, Hesse, North Rhine Westphalia, Saxony (Aug) (EUR/USD, EUR/JPY, DAX)
19:00 EUR ECB’s De Guindos Speaks (EUR/USD, EUR/GBP, DAX)
22:00 EUR German CPI, German HICP (Aug) (EUR/USD, EUR/JPY, DAX)
22:30 USD Core PCE Price Index, Goods Trade Balance, PCE Price Index, Personal Income, Personal Spending, Real Personal Consumption, Retail Inventories Ex Auto, Wholesale Inventories (Jul) (S&P 500, Nasdaq 100, USD/JPY, Gold, Crude Oil)
22:30 GDP Annualised (Q2) (USD/CAD, EUR/CAD, CAD/JPY)
23:00 USD Dallas Fed PCE (Jul) (S&P 500, Nasdaq 100, USD/JPY)
23:45 USD Chicago PMI (Aug) (S&P 500, Nasdaq 100, USD/JPY)
Saturday, August 30, 2025
00:00 USD Michigan 1-Year Inflation Expectations, Consumer Sentiment (Aug) (S&P 500, Nasdaq 100, USD/JPY)
01:00 CAD Budget Balance (Jun) (USD/CAD, EUR/CAD, CAD/JPY)
01:30 USD Atlanta Fed GDPNow (Q3) (S&P 500, Nasdaq 100, USD/JPY)
View the full economic calendar
-- Written by Matt Simpson
Follow Matt on Twitter @cLeverEdge
How to trade with City Index
You can trade with City Index by following these four easy steps:
- Open an account, or log in if you’re already a customer
• Open an account in the UK
• Open an account in Australia
• Open an account in Singapore
- Search for the market you want to trade in our award-winning platform
- Choose your position and size, and your stop and limit levels
- Place the trade
Related tags:







Web Trader platform
Our sophisticated web-based platform is packed with features.
Open an account today
Experience award-winning platforms with fast and secure execution.
Economic calendar
Related articles

Euro Short-term Outlook: EUR/USD Pullback Nears Pivotal Uptrend Support 8 28 2026
Warsh's comments accelerated the EUR/USD selloff, raising the stakes as buyers look to stabilize the broader recovery.


Gold and S&P 500 analysis: What now after Warsh’s hawkish speech?
The dollar surged across the board after the Fed Chair Kevin Warsh surprised with a hawkish-leaning speech at the Jackson Hole summit. All the bearish dollar bets that had been accumulated since last Friday on the back of data weakness and bond market troubles had to be squared and that triggered a short squeeze rally for the dollar. Gold and silver dropped, as a result, as too did bitcoin, while US indices were giving back earlier gains.


EUR/USD forecast: All eyes on Warsh at Jackson Hole - Forex Friday
For much of this week, the EUR/USD has been edging lower with the US dollar regaining some ground after last week’s sell-off that was triggered, in part, by the bond market worries. Investors have been unwilling to bet further against the US dollar so far this week ahead of Kevin Warsh’s keynote speech at the Jackson Hole summit, due later today.