



ASX 200 Falters at Resistance, Pullback Pending?
The ASX 200 has surged 13% from April's low. But with momentum turning around several key levels of resistance, perhaps a pullback is due.
Written by
Matt Simpson
Market Analyst
View related analysis:
- AUD/USD Weekly Outlook: Trimmed Mean Inflation in Focus
- S&P/ASX 200, Hang Seng Analysis: Price Action Setups
- USD/JPY, CAD/JPY, AUD/JPY Price Action Setups
- Japanese Yen (JPY) Sentiment Could Be at an Extreme: COT Report
Economic events in focus (AEDT)
- 17:00 – Spanish CPI
- 19:00 – BOE Deputy Governor Woods Speaks
- 19:40 – MPC Member Ramsden Speaks
- 20:00 – EU Consumer Confidence, Inflation Expectations
- 22:30 – US Trade Balance
- 23:00 – US House Prices
- 00:00 – US Consumer Confidence, JOLTS Job Openings
- 00:30 – US Fed Atlanta GDPnow
ASX 200 at a glance
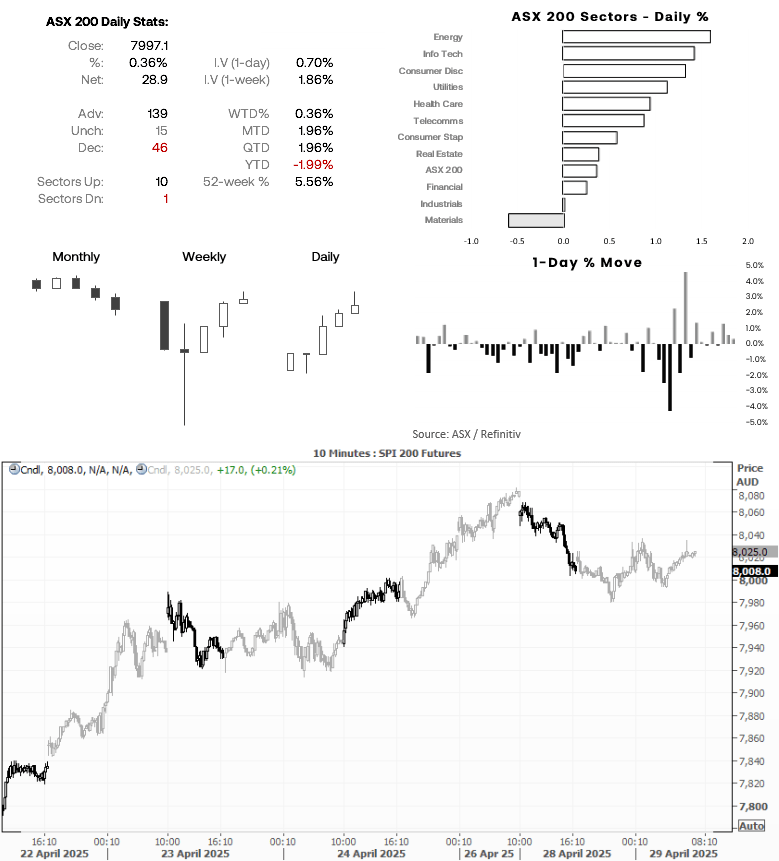
- The ASX 200 cash index rose for a third day on Monday, though the day closed with a small shooting star candle to warn of trend exhaustion
- The ASX also saw a false break above the March high, December low and 8,000 handle and the daily RSI (2) has been overbought since last Wednesday
- So while 10 of the 11 ASX 200 sectors advanced (led by energy and info tech) along with 139 stocks to the 46 that declined, there is a hesitancy for bulls to push forward around current levels
- ASX 200 futures (SPI 200) rose 17 points overnight, though they formed a 2-bear bearish reversal on Monday (Dark Cloud Cover)
ASX 200 Futures (SPI 200) Technical Analysis
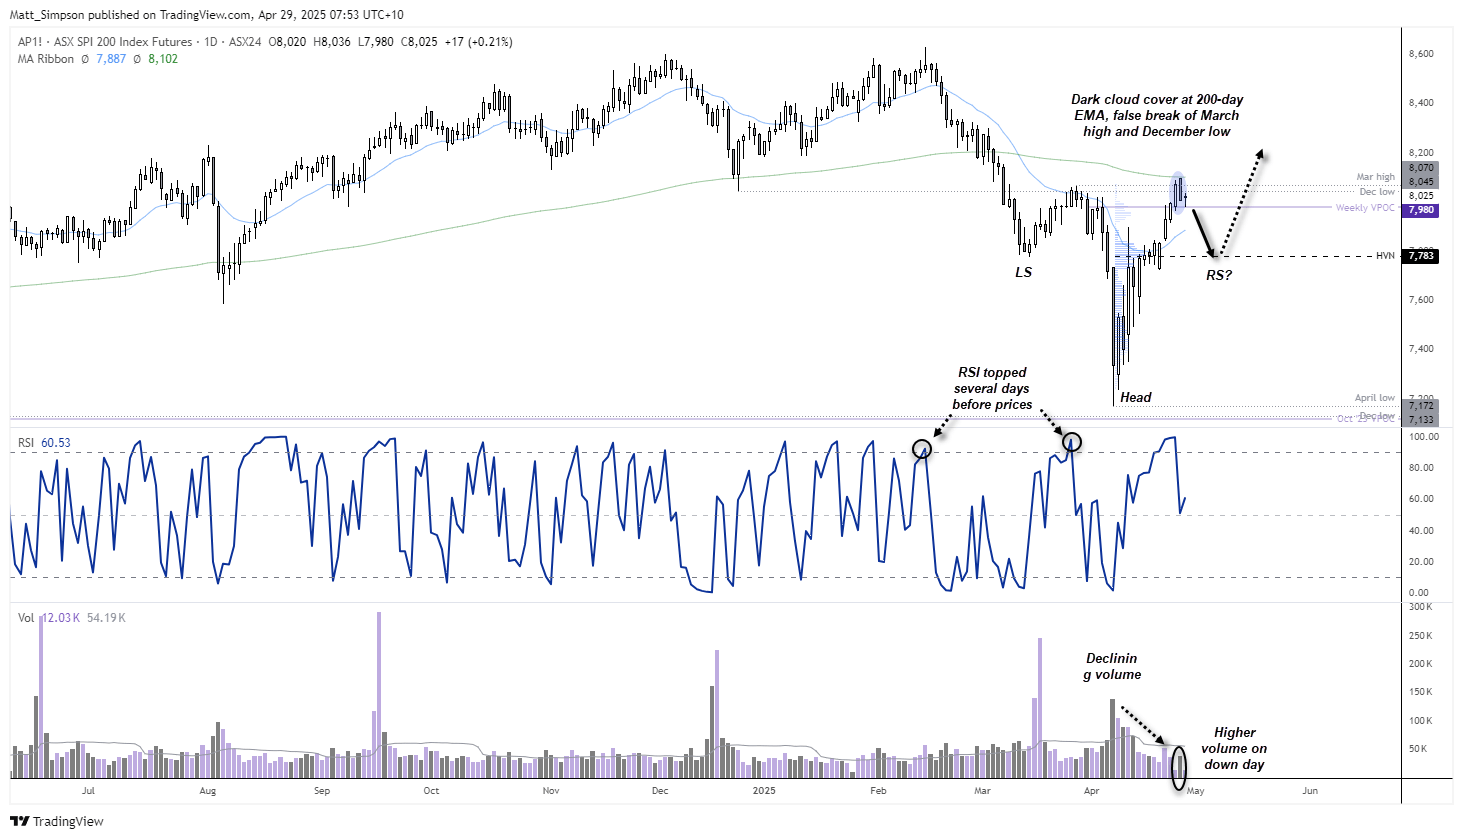
ASX futures have rallied nearly 13% from the April low, though resistance has been met almost perfectly at the 200-day EMA. A two-bar bearish reversal pattern (Dark Cloud Cover) has also formed around the March high and December low. While daily trading volumes declined during the rally, volumes increased overnight as prices fell — suggesting bearish initiation and hinting that the ASX could be nearing an inflection point.
The daily RSI (2) has pulled back from overbought territory. Notably, it took four days between the RSI topping out and the ASX 200 falling from its March 26 high, highlighting the potential for a delayed reaction.
A break beneath the weekly VPOC (7980) could see the ASX retrace towards the 20-day EMA (7887) or the 7900 handle, near the 7783 high-volume node (HVN). If prices do retrace, I will also be watching for a swing low to form as part of a potential ‘right shoulder’ of an inverted head and shoulders bottom.
-- Written by Matt Simpson
Follow Matt on Twitter @cLeverEdge
How to trade with City Index
You can trade with City Index by following these four easy steps:
- Open an account, or log in if you’re already a customer
• Open an account in the UK
• Open an account in Australia
• Open an account in Singapore
- Search for the market you want to trade in our award-winning platform
- Choose your position and size, and your stop and limit levels
- Place the trade
Related tags:







Web Trader platform
Our sophisticated web-based platform is packed with features.
Open an account today
Experience award-winning platforms with fast and secure execution.
Economic calendar
Related articles

Euro Short-term Outlook: EUR/USD Pullback Nears Pivotal Uptrend Support 8 28 2026
Warsh's comments accelerated the EUR/USD selloff, raising the stakes as buyers look to stabilize the broader recovery.


Gold and S&P 500 analysis: What now after Warsh’s hawkish speech?
The dollar surged across the board after the Fed Chair Kevin Warsh surprised with a hawkish-leaning speech at the Jackson Hole summit. All the bearish dollar bets that had been accumulated since last Friday on the back of data weakness and bond market troubles had to be squared and that triggered a short squeeze rally for the dollar. Gold and silver dropped, as a result, as too did bitcoin, while US indices were giving back earlier gains.


EUR/USD forecast: All eyes on Warsh at Jackson Hole - Forex Friday
For much of this week, the EUR/USD has been edging lower with the US dollar regaining some ground after last week’s sell-off that was triggered, in part, by the bond market worries. Investors have been unwilling to bet further against the US dollar so far this week ahead of Kevin Warsh’s keynote speech at the Jackson Hole summit, due later today.