


AUD/JPY Outlook: Reversal Clues Threaten the Mighty Aussie Yen Trend
AUD/JPY shows bearish divergence near historic resistance as the Aussie yen rally stalls. Are 107 and 106 the next downside targets?
Written by
Matt Simpson
Market Analyst
Every so often we hear phrases such as “everything is in the price”, implying a technical analyst does not need to know anything else about a market to make a call. It can be slightly misleading, however, because a supposed reversal pattern – such as a doji near resistance – can quickly be invalidated by fresh news powerful enough to shift sentiment.
That said, there are times when enough technical clues align to justify a ‘punt’, even if the catalyst is not immediately obvious. I believe AUD/JPY ticks that box today.
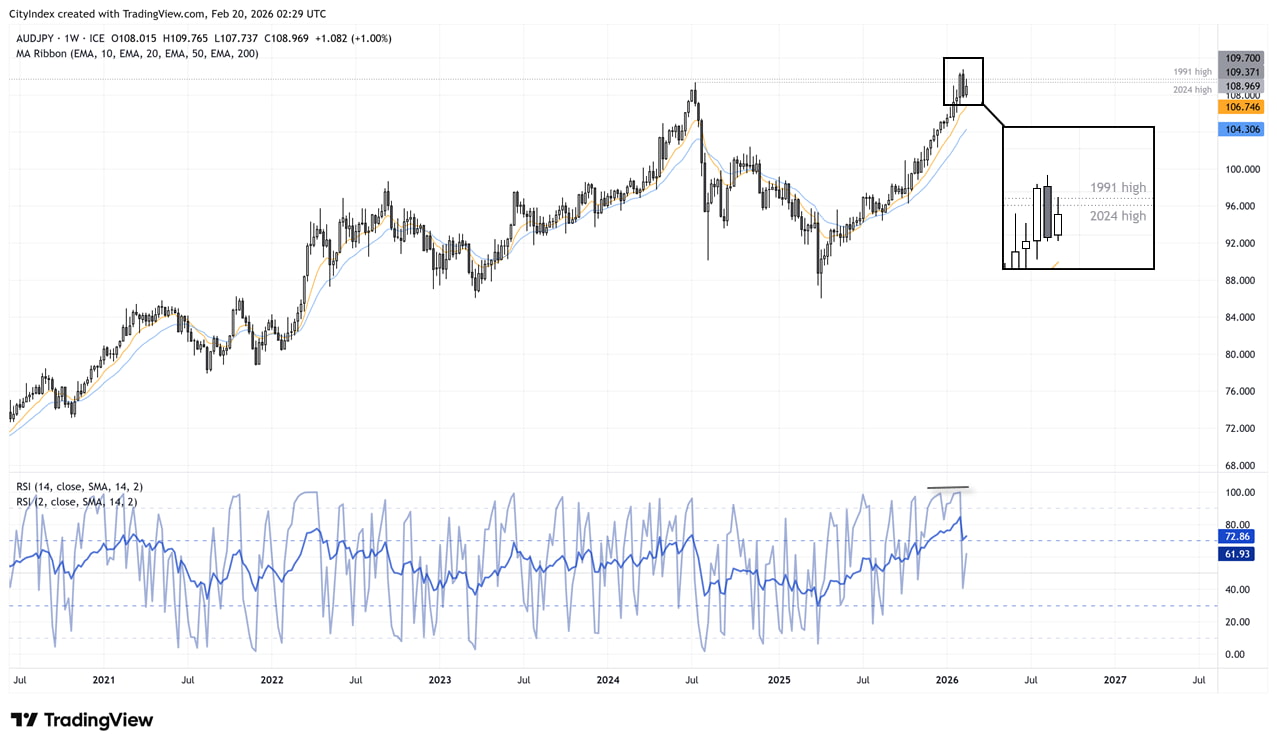
A quick glance at the weekly chart shows that AUD/JPY has staged an outstanding rally since April, when Trump watered down many of his tariffs and struck deals with trade partners. The Australian dollar vs Japanese yen cross has rallied more than 28% since then, largely in a straight line. However, cracks are beginning to emerge in the uptrend, and it could be time for at least a modest pullback.
View related analysis:

AUD/JPY Technical Analysis: Australian Dollar vs Japanese Yen
AUD/JPY weekly chart signals bearish reversal near major historical resistance
A two-bar reversal (dark cloud cover) has formed on the weekly chart around the 2024 and 1991 highs. The fact that we saw a weekly close beneath both of these historical resistance levels appears significant. This week’s high has also respected the 1991 high as resistance, strengthening the case that a retracement may be unfolding.
Furthermore, prices are extended from their 10- and 20-week EMAs, while RSI (2) shows bearish divergence. RSI (14) is also turning lower from extremely overbought territory — another warning sign that upside momentum may be fading.
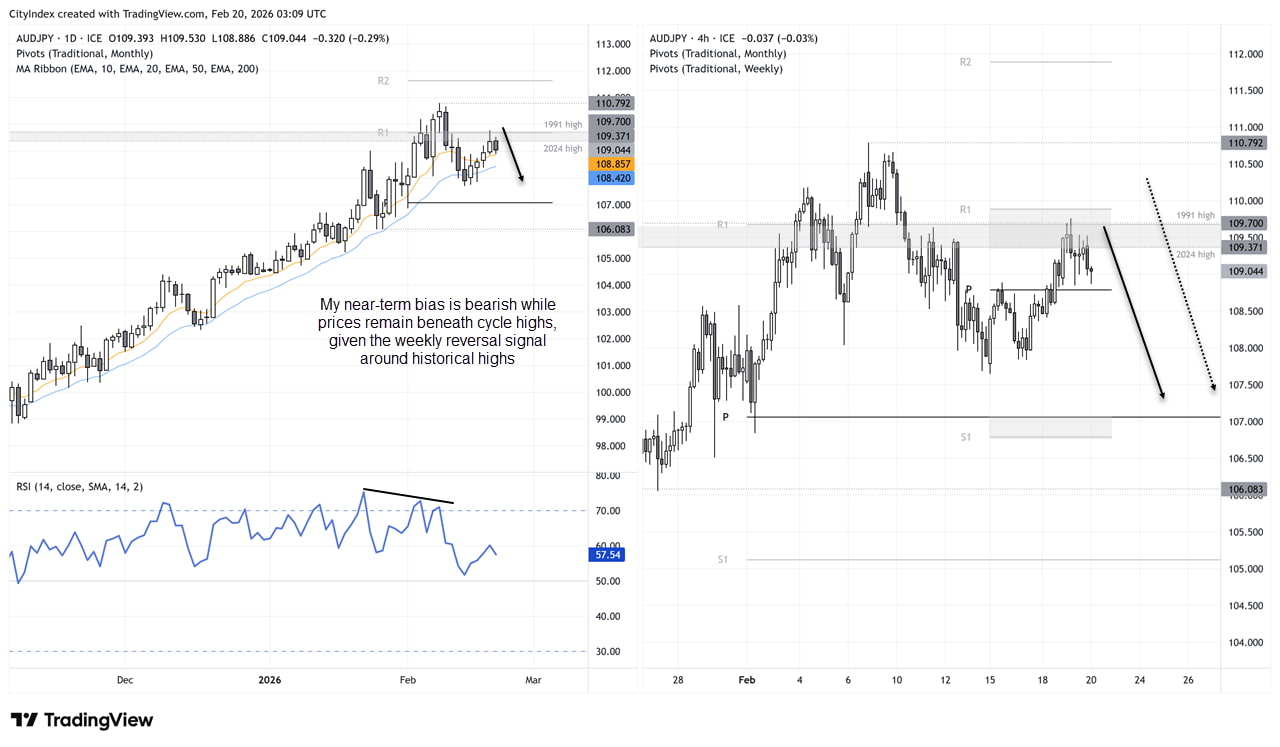
The daily chart show that Thursday’s high respected the monthly R1 pivot as resistance, and the 4-hour also shows the weekly R1 pivot nearby. The daily RSI (14) displayed a bearish divergence ahead of its recent top, and prices are now hinting at a cycle high around resistance – after a 4-day rally.
Source: ICE, TradingView
AUD/JPY price action tests pivot resistance as bearish momentum builds on daily and 4-hour charts
On the daily chart, Thursday’s high respected the monthly R1 pivot as resistance, with the weekly R1 pivot also nearby on the 4-hour timeframe. The daily RSI (14) displayed bearish divergence ahead of the recent high, and price action is now hinting at a potential cycle high near resistance following a four-day rally.
I cannot say with certainty whether we have seen the high for the week. However, given the weekly reversal pattern around major historical resistance, combined with monthly and weekly pivot resistance and bearish RSI divergence, bears may be tempted to fade rallies while AUD/JPY remains below 111.
With momentum turning lower on the 4-hour chart ahead of the weekend, the invalidation level could potentially be lowered towards 110. The 107 handle houses the monthly pivot point, making it a viable downside target for bears. A break beneath 107 would then bring the 106 handle into focus.
Source: ICE, TradingView
Related tags:







Web Trader platform
Our sophisticated web-based platform is packed with features.
Open an account today
Experience award-winning platforms with fast and secure execution.
Economic calendar
Related articles

USD/JPY weekly outlook: Payrolls may challenge the Fed’s hawkish reset
USD/JPY has finally woken from its slumber. Payrolls now loom as the key test of whether the latest hawkish repricing sticks or sinks.

Euro Short-term Outlook: EUR/USD Pullback Nears Pivotal Uptrend Support 8 28 2026
Warsh's comments accelerated the EUR/USD selloff, raising the stakes as buyers look to stabilize the broader recovery.


Gold and S&P 500 analysis: What now after Warsh’s hawkish speech?
The dollar surged across the board after the Fed Chair Kevin Warsh surprised with a hawkish-leaning speech at the Jackson Hole summit. All the bearish dollar bets that had been accumulated since last Friday on the back of data weakness and bond market troubles had to be squared and that triggered a short squeeze rally for the dollar. Gold and silver dropped, as a result, as too did bitcoin, while US indices were giving back earlier gains.
