


EUR/AUD, GBP/AUD, AUD/NZD: Aussie dollar charging as hawkish RBA bets build
Australia’s latest inflation report was ugly enough to make mortgage holders feel sick, and traders have responded by rapidly ramping up RBA hike bets. The Aussie is now breaking key levels across the major crosses.
Written by
David Scutt
Market Analyst
- July inflation report turbocharges RBA hike pricing
- EUR/AUD breaks 1.6260, downside momentum builds
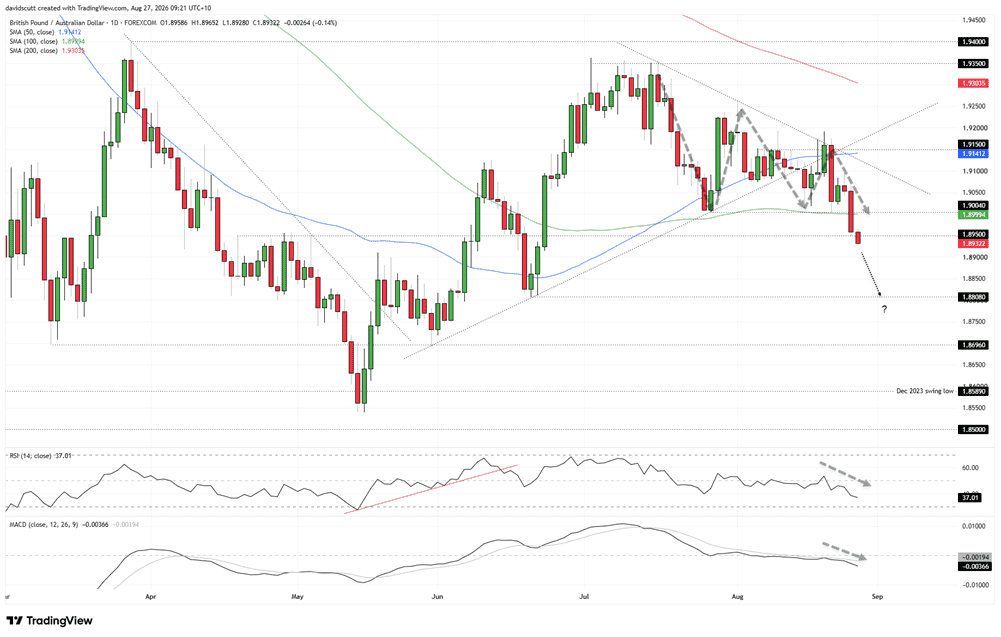
- GBP/AUD slips beneath 1.8950 support
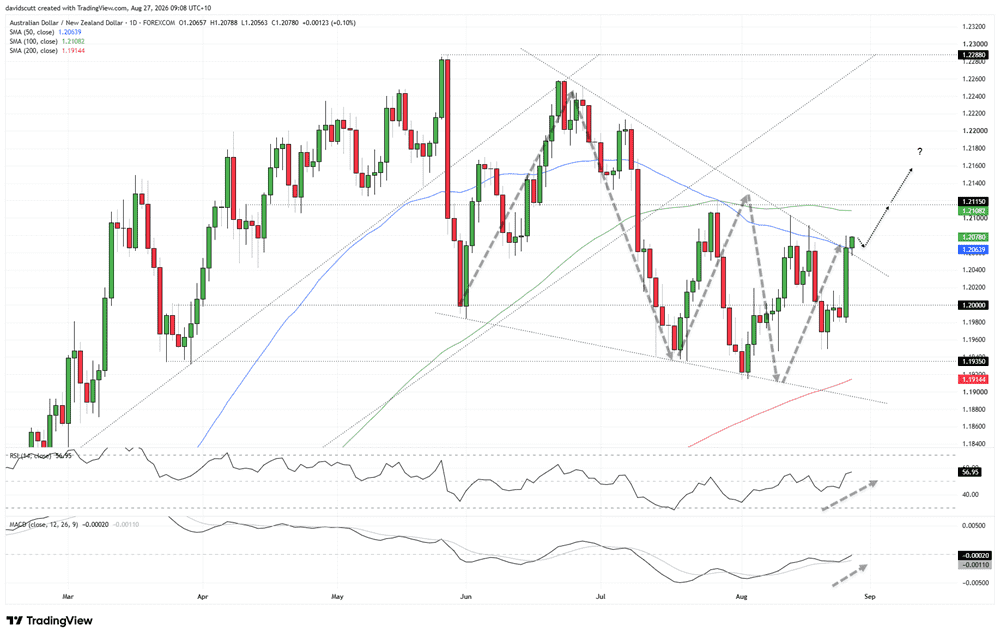
- AUD/NZD clears falling wedge structure
The Aussie dollar is flying against the crosses, powered by a rapid increase in hawkish RBA pricing after an uncomfortably hot inflation report on Wednesday was followed by strong household spending data on Thursday. Rather than weakening as the RBA needs to see, household demand appears to be picking up noticeably, adding to upside inflation risks given Australia’s weak productivity growth.
Rather than AUD/USD, which is far more susceptible to shifts in broader risk appetite, moves against the major crosses such as the euro, British pound and Kiwi offer a much cleaner expression of interest rate differentials. And with markets now borderline pricing a full RBA rate hike by November, the Aussie is breaking key levels against each of them.
Hot inflation sends RBA hike bets surging
The initial catalyst for the latest bout of Aussie dollar strength was Australia’s July inflation report, which revealed not only that headline inflation remained firmer than many expected, but that underlying inflationary pressures are continuing to accelerate.
Headline inflation rose 1.0% for the month, leaving the annual rate at 3.5%. While that was down from June, it was still above the 3.3% level expected by markets. Trimmed mean inflation, the RBA’s preferred underlying measure, printed so ugly that anyone with a mortgage would feel sick, rising 0.5% for the month and leaving the annual rate unchanged at 3.6%, more than a full percentage point above the RBA’s 2.5% midpoint target.
Source: TradingView, FOREX.com
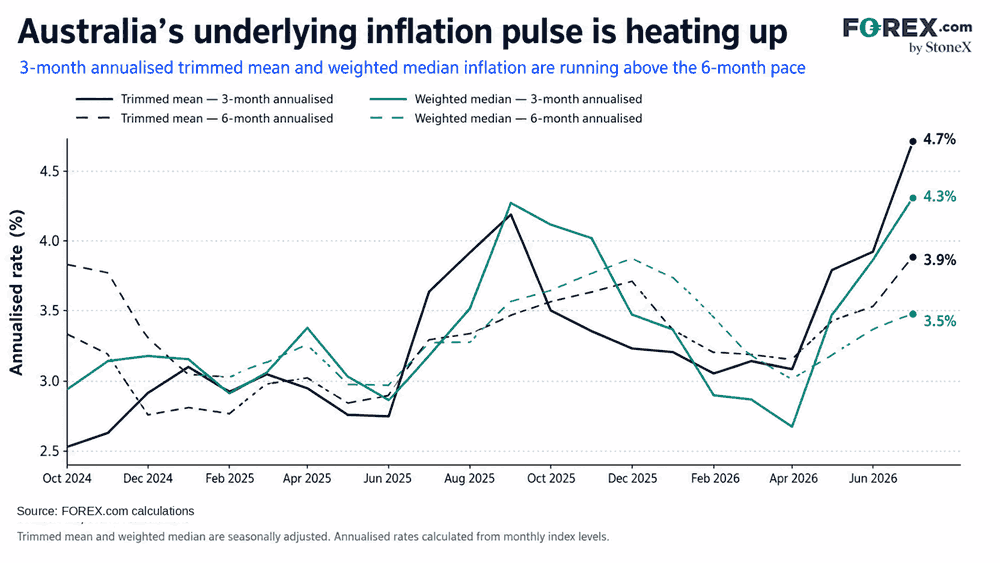
When you look at the chart above showing the shorter-term pulse of underlying inflation, you can see that it’s not only running well above acceptable levels, but accelerating away from them. That makes it difficult for the RBA to argue current policy settings are sufficiently restrictive to bring inflation back to target within the next year, as its forecasts earlier this month imply.
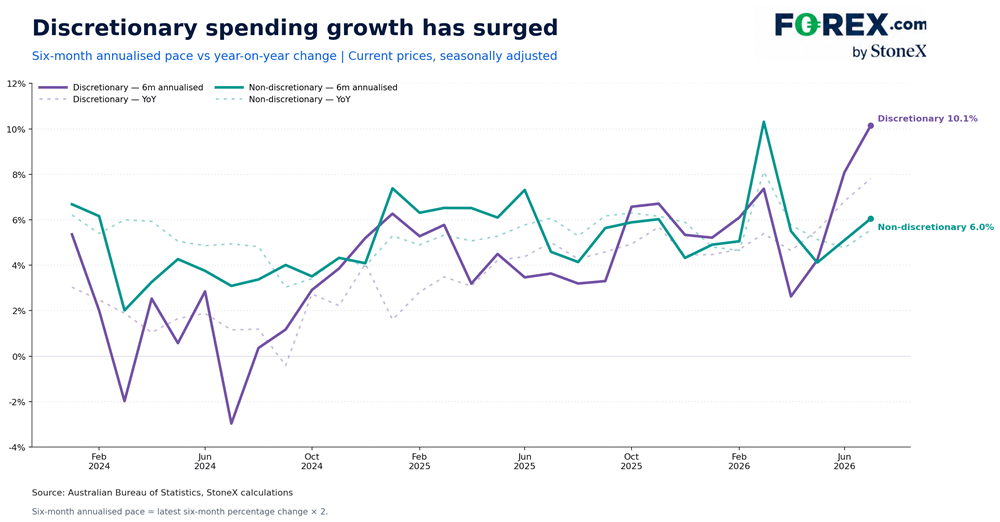
Complicating matters further, household spending data for July released earlier today came in nearly three times stronger than expected, with nominal spending rising 1.1% for the month versus 0.4% expected. That left spending 7.0% higher than a year earlier, the strongest annual increase since June 2023.
As seen in the graphic below, the nearer-term pulse is even stronger. Discretionary spending is now running at a six-month annualised pace of over 10%, the kind of growth you need to go back to the COVID reopening period in 2022 to see.
Source: TradingView, FOREX.com
For a central bank that has repeatedly said it needs to see demand soften before it can be confident inflation will return sustainably to target, this is exactly the kind of data it would not want to see.
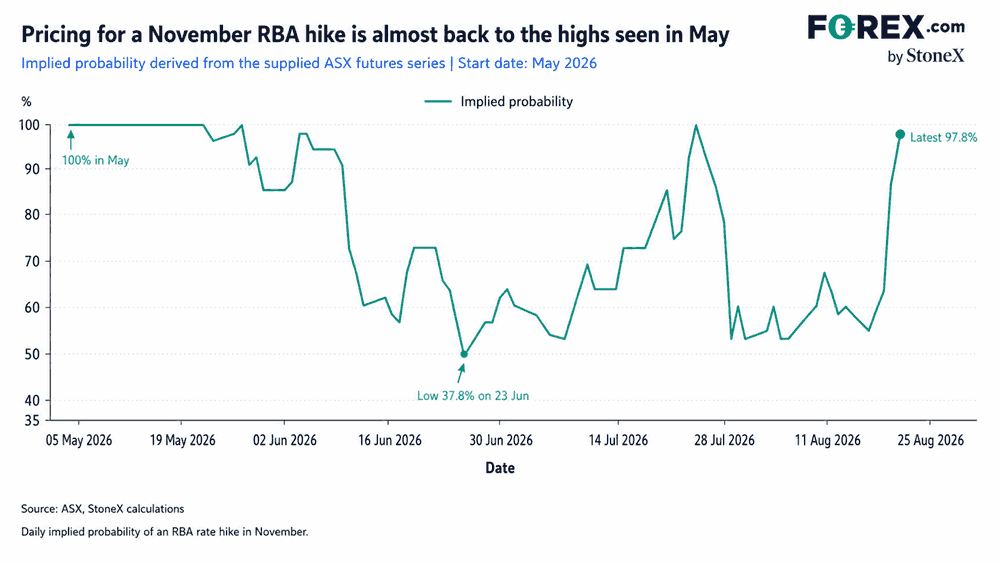
Market pricing for another RBA rate hike ticked higher following the release, with a move by November now seen as close to a lock at just shy of 98%. There has also been a noticeable shift toward the risk of an earlier move in September, with the implied probability based on futures lifting from around 14% earlier this week to nearly a 50-50 bet.
Source: TradingView, FOREX.com
The sharp repricing at the front end of the Australian rates curve has provided another tailwind for the Aussie dollar against the major crosses. Firm risk appetite is adding additional support, favouring the higher-beta Aussie over lower-beta European names.
This content was created by an affiliate of FOREX.com and represents the views and opinions of the author/speakers, not the views and opinions of FOREX.com, StoneX Group Inc., or its subsidiaries. The content has not been independently reviewed by FOREX.com.
EUR/AUD downside may have legs
Source: TradingView
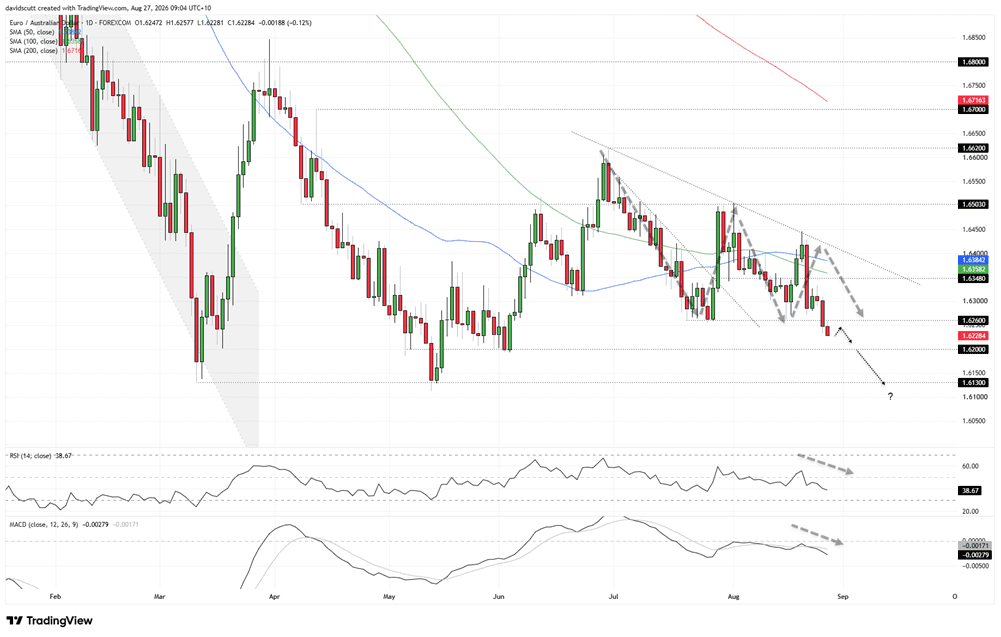
On the back of Australia’s July inflation report, EUR/AUD broke beneath support at 1.6260, leaving the pair trading at its lowest level since early June. We then saw a backtest and rejection of the level, which has resulted in a further extension of the move in early Asian trade.
The breakdown arrived after a period of gradually coiling price action, with downtrend resistance running from the early-July highs capping bullish breakout attempts on two occasions. That adds to the sense that this downside move may have legs.
With RSI (14) trending lower but not yet oversold, while MACD has staged a bearish crossover and continues to diverge from the signal line in negative territory, there’s confirmation that downside momentum is building. That puts a potential retest of 1.6200 on the table, a level that acted as support during periods in May and June.
A break beneath there would put the double bottom from earlier this year at 1.6130 in play.
While the price action looks heavy, it would be preferable to see another retest and rejection at 1.6260 before entry, allowing for a tight stop above the level for protection, targeting 1.6200 initially. Alternatively, for those who want to get involved immediately, just ensure the appropriate risk-reward of the setup is sized up prior to entry, ensuring a stop is placed for protection.
A reversal back above 1.6260 that sticks would invalidate the bearish setup, pointing to the potential for a return to range trading or even upside.
GBP/AUD breakdown extends
Source: TradingView
We have an almost identical setup in GBP/AUD, with the inflation report helping spark a breakdown through the confluence of the 100-day moving average and support at 1.9004.
That move extended to 1.8950, another level that has acted as both support and resistance on multiple occasions so far this year. In early Asian trade, we’ve now seen that level give way, with the pair breaking beneath it.
Coming after a period of gradual coiling in a structure resembling a descending triangle, that points to the potential for the downside move to extend, bringing the mid-June swing low at 1.8808 into play. Beyond that, 1.8696 is another level to watch, having also acted as both support and resistance on multiple occasions this year.
The merits of short setups are strengthened by the message from the oscillators, with RSI (14) continuing to set lower highs and lower lows but not yet oversold. MACD is also confirming the move, staging a bearish crossover and continuing to diverge from the signal line in negative territory, indicating that downside momentum is building.
Unlike EUR/AUD, the entry level is far more appealing given the proximity of 1.8950. Shorts could be established beneath the level with a tight stop above for protection, targeting 1.8808 initially and 1.8696 beyond that.
Of course, if we were to see a reversal back above 1.8950 that holds, it would invalidate the bearish setup, at least at this stage.
AUD/NZD wedge breakout
Source: TradingView
Turning to AUD/NZD, we’re seeing a breakout of a different form, with the pair now trading above the upper boundary of the falling wedge structure that had been in place since the middle of June.
Coming after what was an extended bullish run earlier this year, it points to the potential for an eventual retest of the highs set back in May at 1.2280, should the breakout stick.
The 50-day simple moving average is a level I’m watching closely now, sitting just above the upper boundary of the wedge structure. If the price continues to hold above it, longs could be considered with a tight stop beneath either the moving average or the upper boundary of the wedge, targeting 1.2100 initially, where the price stalled on August 13.
Beyond that, the next area to watch is the confluence of the 100-day moving average and resistance at 1.2115. If the price can break above that zone, it would build confidence that a possible retest of the year-to-date highs is in play, putting levels such as 1.2140, 1.2200 and 1.2250 on the radar in between.
The message from the oscillators is one of shifting momentum. RSI 14 is now starting to trend higher and has moved back above the neutral 50 level. MACD is also on the cusp of flipping positive, having already crossed the signal line but remaining in negative territory.
At the very least, that suggests the downside momentum that had been evident has now dissipated, with the potential for upside strength to resume building.
Of course, if the price was to reverse lower back within the wedge structure, it would point to the possibility of another leg lower, putting 1.2000 back in focus given it has acted as both support and resistance on multiple occasions so far this year.







Web Trader platform
Our sophisticated web-based platform is packed with features.
Open an account today
Experience award-winning platforms with fast and secure execution.
Economic calendar
Related articles

Euro Short-term Outlook: EUR/USD Pullback Nears Pivotal Uptrend Support 8 28 2026
Warsh's comments accelerated the EUR/USD selloff, raising the stakes as buyers look to stabilize the broader recovery.


Gold and S&P 500 analysis: What now after Warsh’s hawkish speech?
The dollar surged across the board after the Fed Chair Kevin Warsh surprised with a hawkish-leaning speech at the Jackson Hole summit. All the bearish dollar bets that had been accumulated since last Friday on the back of data weakness and bond market troubles had to be squared and that triggered a short squeeze rally for the dollar. Gold and silver dropped, as a result, as too did bitcoin, while US indices were giving back earlier gains.


EUR/USD forecast: All eyes on Warsh at Jackson Hole - Forex Friday
For much of this week, the EUR/USD has been edging lower with the US dollar regaining some ground after last week’s sell-off that was triggered, in part, by the bond market worries. Investors have been unwilling to bet further against the US dollar so far this week ahead of Kevin Warsh’s keynote speech at the Jackson Hole summit, due later today.