


AUD/USD, NZD/USD Extend Gains, Though AUD/NZD Flashes Reversal Risk
AUD/USD and NZD/USD rally on peace deal hopes and a weaker US dollar, while AUD/NZD signals a potential bearish reversal from 13-year highs.
Written by
Matt Simpson
Market Analyst
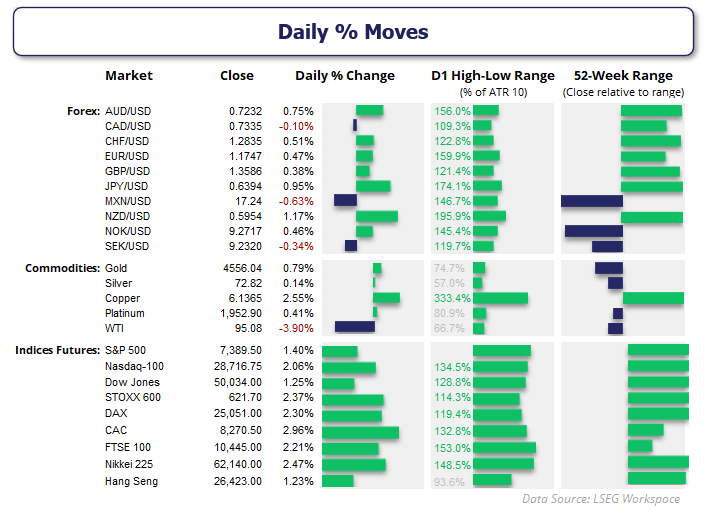
Wall Street reached fresh highs, crude oil fell more than 7%, and the US dollar tracked lower during another risk-on session as traders bet the US and Iran are moving closer to a legitimate peace deal. That provided a tailwind for the Australian dollar and New Zealand dollar, both of which posted solid breakouts — with NZD/USD and AUD/USD leading the FX majors on the day.
View related analysis:
This came despite fingers once again being pointed at Japan’s Ministry of Finance (MOF) over another suspected round of yen intervention during Wednesday’s Asian session. While the yen surged against all its peers, the moves were not up to the size of Thursday’s and most or all of the yen’s gains evaporated by the end of the US session.
While the Australian dollar has finally broken out and is reaching for 73c, it is being left behind by the New Zealand dollar — and that points to potential bearish reversal risk for AUD/NZD over the near term.
Source: LSEG
Australian Dollar and New Zealand Dollar Rally as AUD/NZD Faces Reversal Risk
AUD/USD Breakout Hands Back Gains
I must admit that I am a little underwhelmed by the breakout on AUD/USD, though it does make sense give the RBA were not quite as hawkish as they could have been. While they left plenty of wriggle room for further tightening alongside their 25bp hike this week, their revised forecast simply put their OCR in line with market expectations prior to the meeting.

AUD/USD Rally Stalls Beneath Key Resistance
The daily chart shows a solid close above 0.72 for AUD/USD on Wednesday, although it handed back around half of the day’s gains after failing to test the May 2022 high at 0.7283. So while it was a strong session overall, the weak finish slightly undermined the earlier bullish momentum.
Bulls may prefer to wait for a pullback towards 0.72 before seeking fresh longs in anticipation of another attempt on 0.73. However, note that the monthly R1 pivot near 0.7381 could also provide resistance.

Source: ICE TradingView
NZD/USD Technical Analysis: New Zealand Dollar vs US Dollar
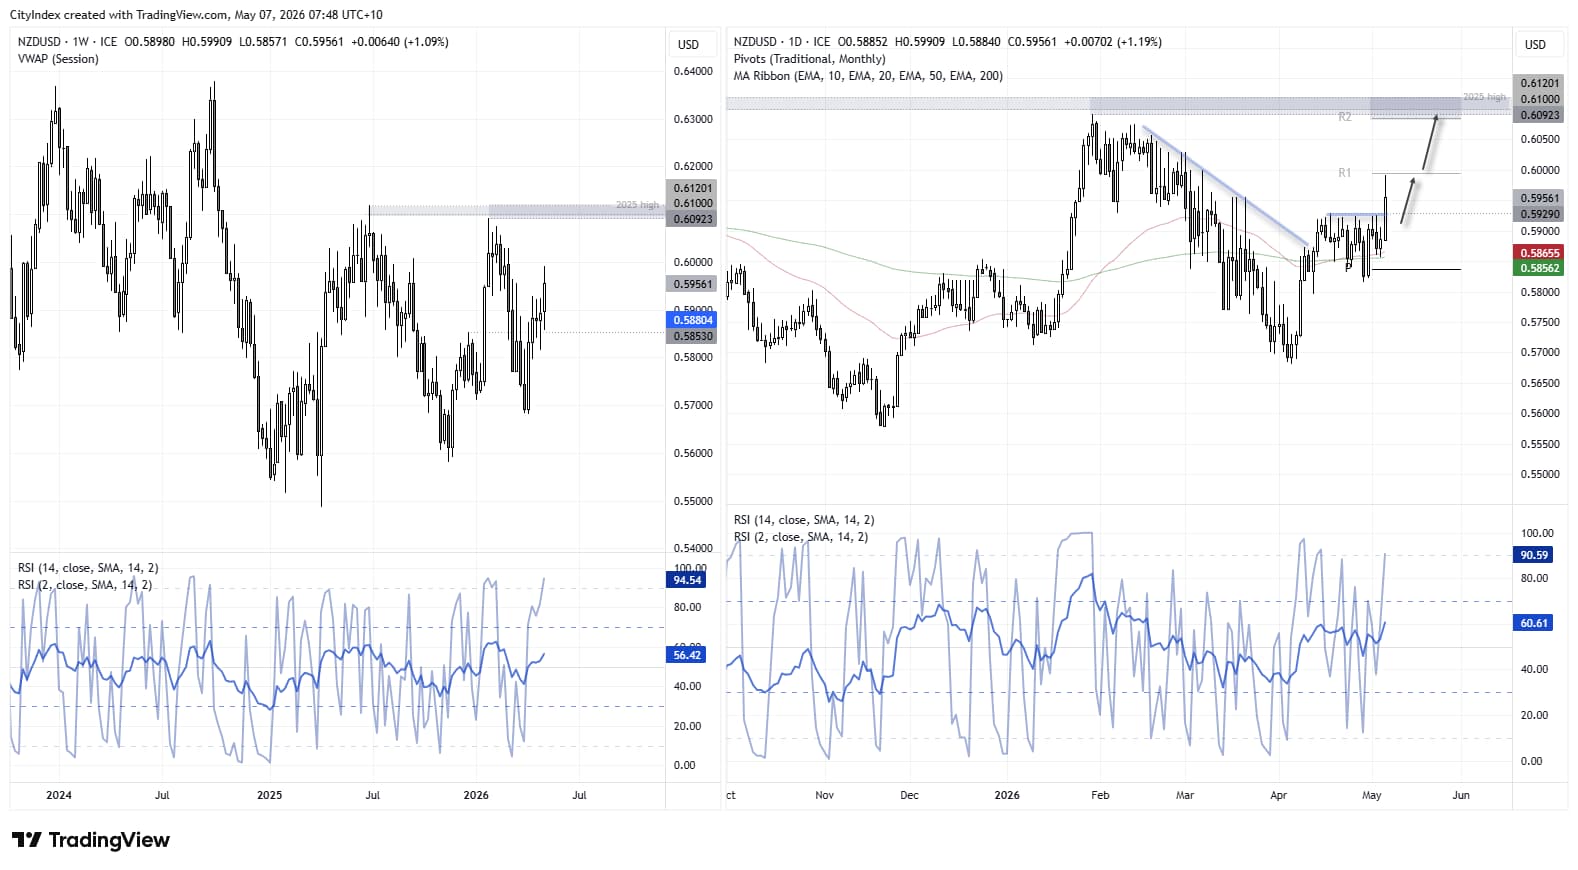
While the NZD/USD weekly chart still lacks a clear trend, the daily breakout is more convincing than the move seen on AUD/USD. Wednesday’s bullish range expansion marked the New Zealand dollar’s second-strongest session of the month after support formed around the 200-day and 50-day EMAs on Tuesday.
NZD/USD also held onto more of its gains into the close relative to the Australian dollar, likely only pausing because the monthly R1 pivot sits near the 0.60 handle.
From here, NZD/USD appears primed for a move towards 0.61 near the January highs. And if the kiwi continues to outperform the Aussie as suspected, it also supports a near-term bearish bias for AUD/NZD.
Source: ICE TradingView

AUD/NZD Technical Analysis: Australian Dollar vs New Zealand Dollar
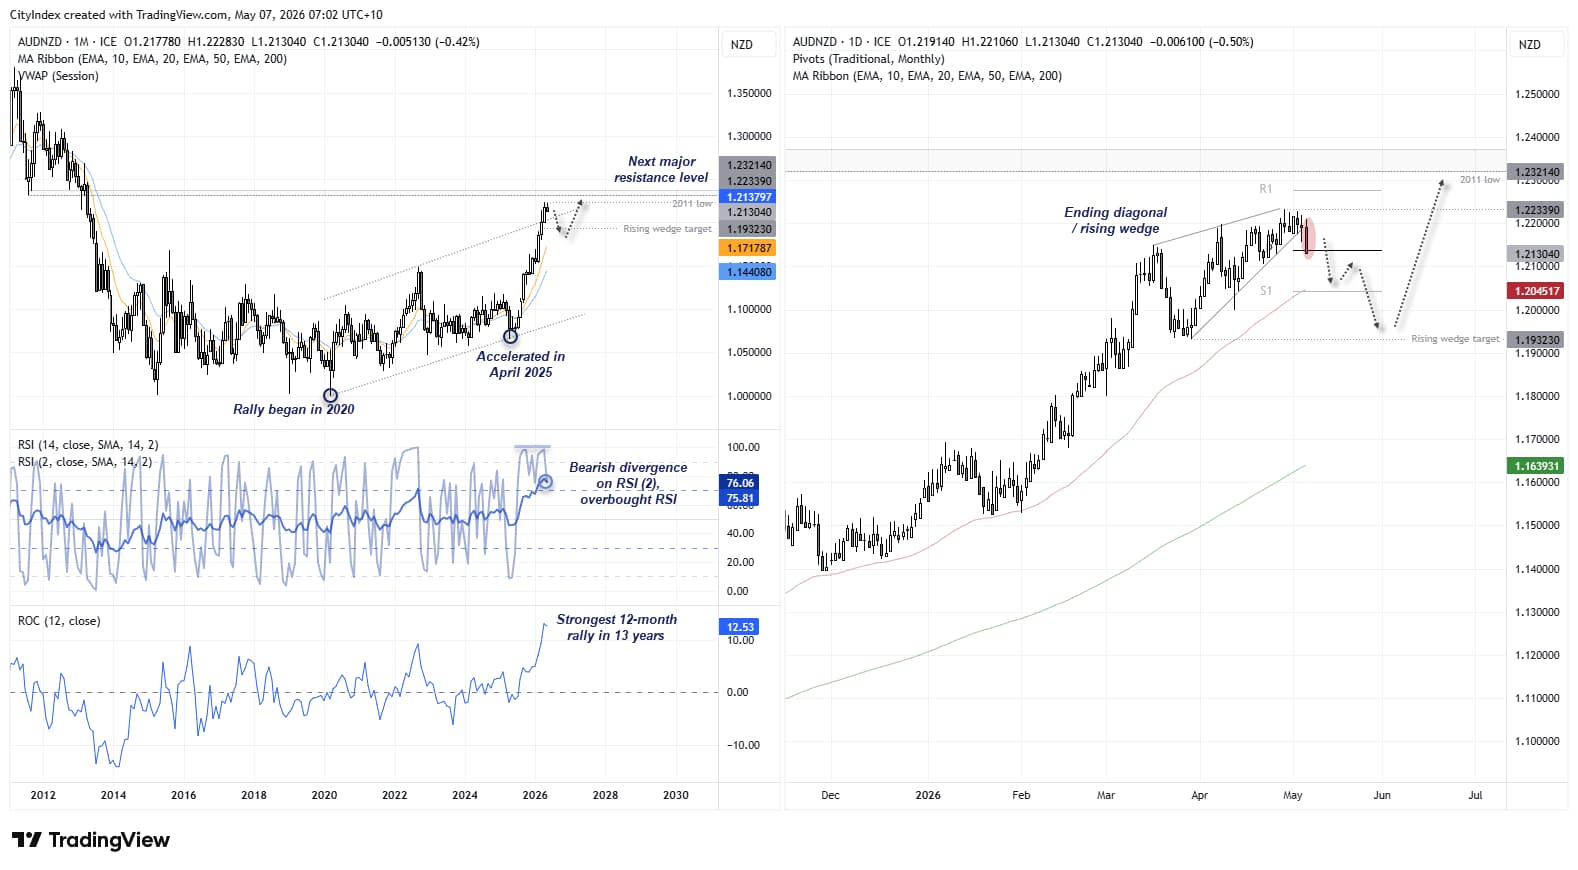
The AUD/NZD cross reached a 13-year high last week, with the Australian dollar’s rally against the New Zealand dollar over the past year marking its strongest advance since 2008. Given this acceleration builds on an uptrend that began in 2020, it suggests AUD/NZD may still have further upside potential. However, with the monthly rate of change (ROC) at 12.7%, an overbought RSI (14), and bearish divergence on RSI (2), a pullback may be required first. It is therefore worth noting the bearish reversal pattern unfolding near the cycle highs.
The daily chart shows a rising wedge, or ending diagonal — the latter named in Elliott Wave Theory because it often appears near the end of strong trends. If confirmed, the wedge projects a downside target near the cycle low at 1.1932. While AUD/NZD found support at its monthly pivot point on Wednesday, bearish momentum has since seen price break below the lower boundary of the alleged wedge. A sustained break beneath the monthly pivot point opens the door for a move towards the 50-day EMA (1.2045) near the monthly S1 pivot, bringing the 1.20 handle and 1.1932 low into view.
A break above the 1.2239 cycle high invalidates the near-term bearish bias for AUD/NZD and instead shifts focus towards the 1.23 handle near the 2011 low.
Source: ICE TradingView
View the full economic calendar
-- Written by Matt Simpson
Follow Matt on Twitter @cLeverEdge
How to trade with City Index
You can trade with City Index by following these four easy steps:
- Open an account, or log in if you’re already a customer
• Open an account in the UK
• Open an account in Australia
• Open an account in Singapore
- Search for the market you want to trade in our award-winning platform
- Choose your position and size, and your stop and limit levels
- Place the trade







Web Trader platform
Our sophisticated web-based platform is packed with features.
Open an account today
Experience award-winning platforms with fast and secure execution.
Economic calendar
Related articles

USD/JPY weekly outlook: Payrolls may challenge the Fed’s hawkish reset
USD/JPY has finally woken from its slumber. Payrolls now loom as the key test of whether the latest hawkish repricing sticks or sinks.

Euro Short-term Outlook: EUR/USD Pullback Nears Pivotal Uptrend Support 8 28 2026
Warsh's comments accelerated the EUR/USD selloff, raising the stakes as buyers look to stabilize the broader recovery.


Gold and S&P 500 analysis: What now after Warsh’s hawkish speech?
The dollar surged across the board after the Fed Chair Kevin Warsh surprised with a hawkish-leaning speech at the Jackson Hole summit. All the bearish dollar bets that had been accumulated since last Friday on the back of data weakness and bond market troubles had to be squared and that triggered a short squeeze rally for the dollar. Gold and silver dropped, as a result, as too did bitcoin, while US indices were giving back earlier gains.
