


Bitcoin Analysis BTC continues to show weakness around 60k
A consistent weak bias remains present in Bitcoin price action over the last few sessions. Although the price attempted to recover above 60k over the weekend, BTC is currently down close to -2.6% over the past three trading sessions, continuing to reflect relevant short-term weakness.
Written by
Julian Pineda
Market Analyst
A consistent weak bias remains present in Bitcoin price action over the last few sessions. Although the price attempted to recover above 60k over the weekend, BTC is currently down close to -2.6% over the past three trading sessions, continuing to reflect relevant short-term weakness.
For now, selling pressure remains important, amid ongoing concerns around the Middle East and the inflationary pressures that have started to appear in recent data. This environment has not allowed demand for cryptocurrency to stabilize clearly in the short term. If this dynamic continues, selling pressure could remain an important driver of Bitcoin’s movements over the coming sessions.

Demand fails to recover
So far, the trading week continues to be shaped by geopolitical and macroeconomic events. During the session, reports of a new round of attacks between the United States and Iran once again cast doubt on the possibility of negotiations and revived part of the tensions between both countries. This shows that, for now, the situation in the Strait of Hormuz remains delicate. It has even been reported that some tankers are using unconventional routes to cross and avoid detection, which suggests that energy transit is still far from normal. This uncertainty keeps the risk alive that oil prices could remain an inflationary threat this year.
In fact, this inflationary effect has already started to appear in recent US annual CPI data, where the figure came in at 4.2%, above the 4.00% level, a zone not seen since 2023. What has worried markets the most in the short term is that inflation is being driven mainly by energy. Gasoline rose around 7.00%, and increases in energy costs explained more than 60% of the monthly CPI advance in May in the United States. This shows that geopolitical uncertainty is not only still present but is also starting to change the macroeconomic conditions of countries such as the United States.
This combination of factors is especially relevant for Bitcoin, as the cryptocurrency continues to depend heavily on available liquidity and market confidence to recover consistent demand. As these conditions show that the geopolitical and economic environment is not the most favorable during 2026, investors may be favoring more stable markets or traditional risk assets over cryptocurrencies in the short term.
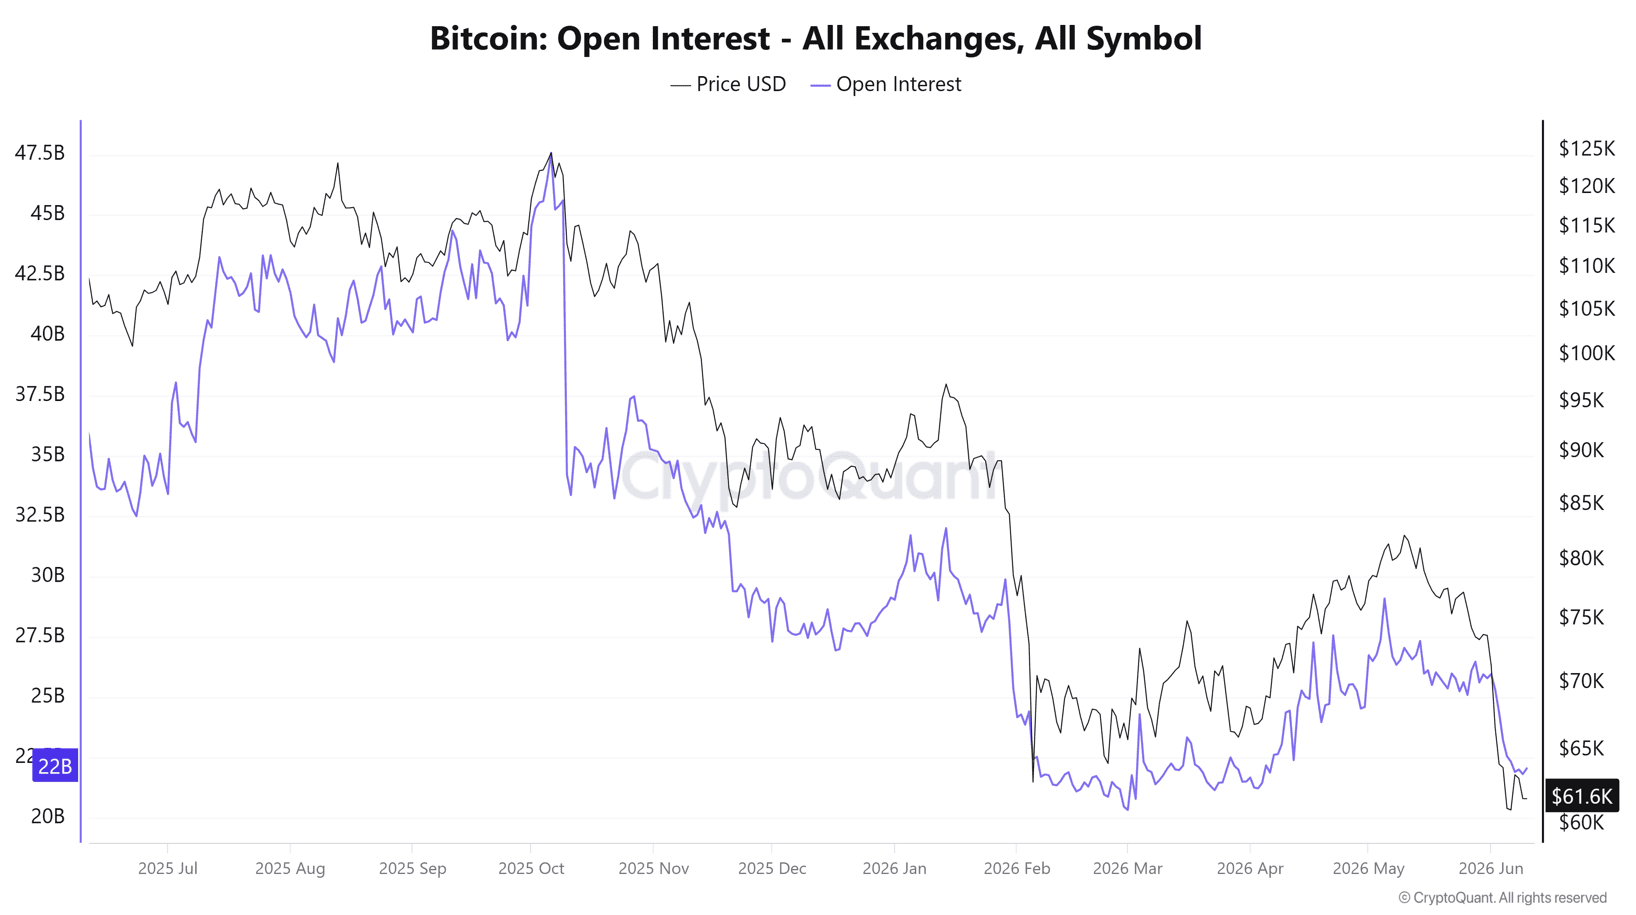
This effect is also reflected in Bitcoin network dynamics, especially through Open Interest, an indicator that measures the total number of open long and short positions in the market and helps track part of institutional and retail demand. Now, Open Interest continues to show weakness around the 22B area, close to 2026 lows, reflecting a meaningful outflow of capital over the last few sessions.
When this decline is combined with Bitcoin’s persistent price weakness, the picture suggests that the exit of long positions remains an important factor. For now, there are no clear signs of meaningful new position inflows into the market, keeping demand for cryptocurrency weak in an environment marked by short-term geopolitical and economic uncertainty.
Source: Cryptoquant
Taking all of this into account, if there is no more favorable environment capable of restoring confidence in non-traditional risk assets such as cryptocurrencies, demand may continue to struggle to show a consistent recovery. This could keep Bitcoin weakness relevant over the coming trading sessions.
Confidence remains near lows
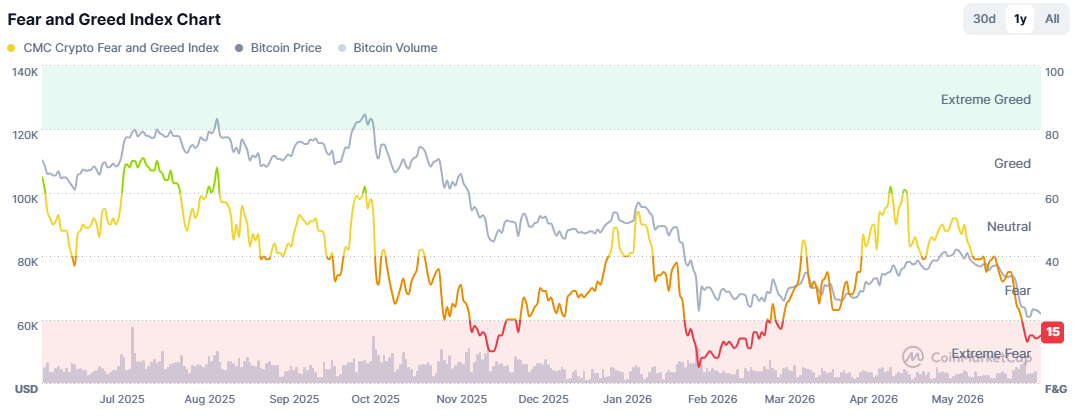
Looking at the Crypto Fear and Greed Index, the indicator has returned to the 14-point area during the session. What stands out is that it continues to trade consistently in “extreme fear” territory, below last week’s levels and far from the readings seen a month ago. This confirms that the short-term loss of confidence has become an important factor for the market, and for now, there are no clear signs of recovery.
Source: Coinmarketcap
This behavior is important because, while sentiment remains in negative territory, it will be difficult to build a favorable environment for consistent cryptocurrency demand over the coming sessions. If the index continues to fall, it could suggest that market participants’ perception is still deteriorating, affecting the possibility of a short-term demand recovery and keeping possible selling pressure on BTC.
Technical outlook for Bitcoin
Source: StoneX, Tradingview
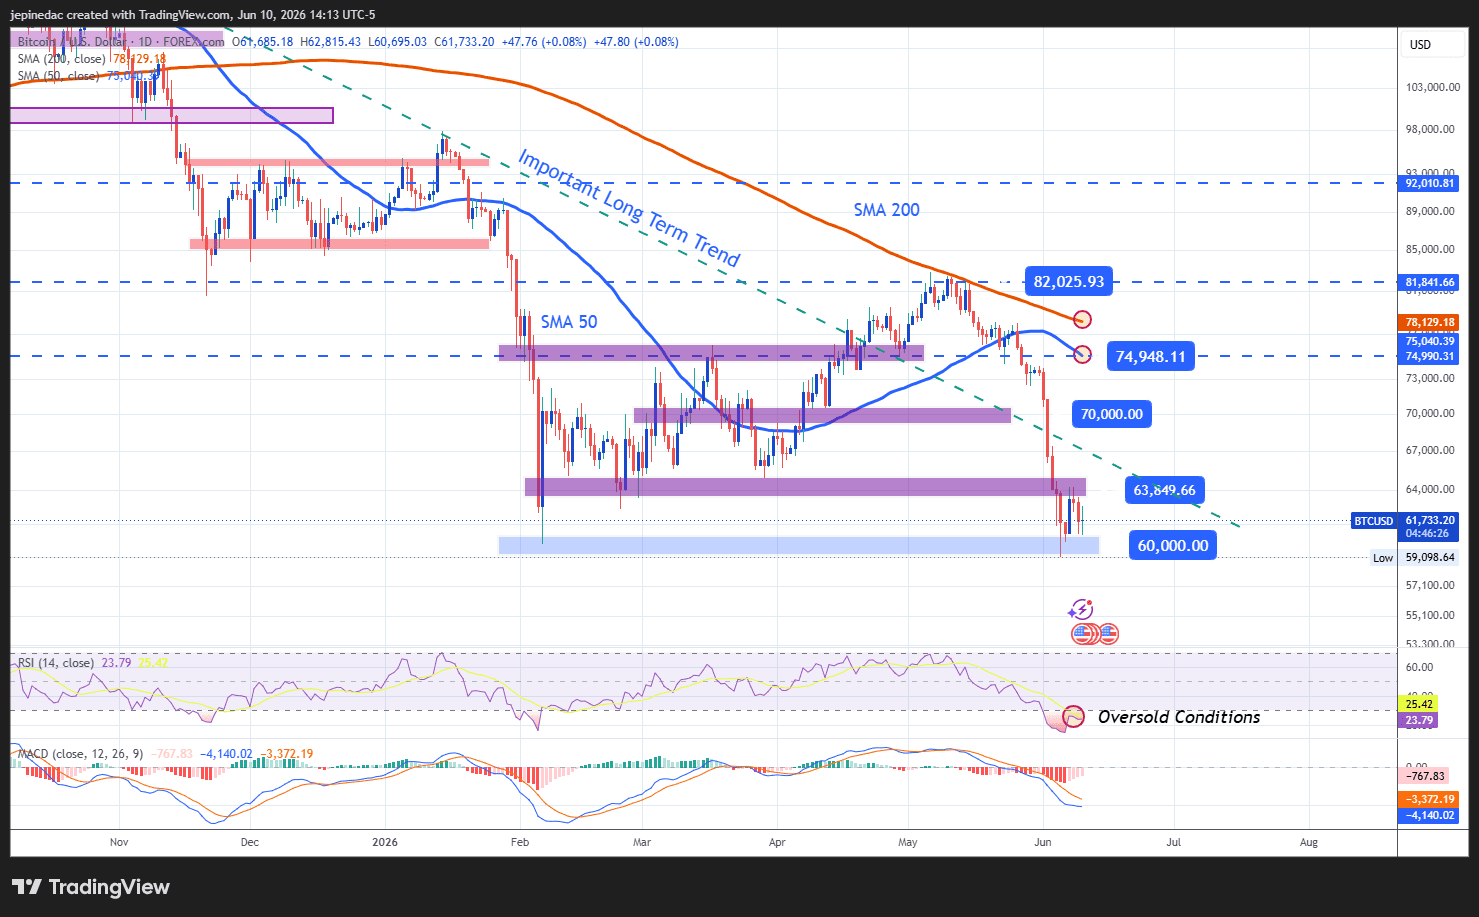
- The major bearish trendline remains relevant: At the moment, the dominant technical pattern on the BTC daily chart remains the major bearish trendline that has guided price action over the last few months. For now, given the lack of relevant bullish corrections, this structure continues to be the most important technical pattern to monitor. If selling pressure remains present in short-term price action, this trendline could continue to extend over the coming weeks.
- MACD: At the moment, the MACD indicator continues to move below the neutral 0 line, indicating that the average strength of short-term moving averages is still showing relevant selling pressure. This suggests that the bearish bias around BTC could remain important over the coming sessions.
- RSI: RSI line shows a similar picture, as the indicator remains below the 50 level, reflecting bearish dominance in short-term momentum. However, the indicator has also fallen sharply below the 30 area, a level associated with oversold conditions. This could be warning of a possible excess of selling pressure in Bitcoin’s recent movements and may leave room for mild bullish corrections over the coming sessions.
Key levels:
- 70,000 – Important resistance: Relevant high area located around an important psychological level for the market. Price action that manages to recover this zone would not only put the major bearish trendline at risk, but could also begin to show a relevant buying bias for the coming weeks.
- 63,800 – Near-term barrier: Recent pullback level from the last few sessions and a possible barrier to monitor if the price starts to form short-term bullish corrections.
- 60,000 – Definitive support: A low area not seen since 2024 and the main psychological support level to monitor now. Price action below this barrier could extend the dominance of the selling bias and give continuity to the major bearish trendline over the coming trading sessions.
Written by Julian Pineda, CFA, CMT – Market Analyst
Follow him on: @julianpineda25
Related tags:







Web Trader platform
Our sophisticated web-based platform is packed with features.
Open an account today
Experience award-winning platforms with fast and secure execution.
Economic calendar
Related articles

Bitcoin Forecast: BTC/USD Back to $80K Ahead of Warsh’s Jackson Hole Speech
After surging over $15,000 in the past 10 days alone, there is risk of a near-term pullback if Warsh says anything remotely hawkish at Jackson Hole - what are the levels to watch from here?


Bitcoin’s failed breakouts are becoming hard to ignore
Three failed breakout attempts and fading momentum have put Bitcoin bulls on notice. Another rejection could open the door lower just as attention swings back towards NVIDIA and the AI trade.


PCE hype now rarely matches market moves
PCE may still matter to policymakers at the Fed, but for traders looking for a genuine volatility event, CPI has been the far more reliable release.