


Bitcoin & Nasdaq Outlook: US-Iran Tensions, CPI and Earnings
Bitcoin and Nasdaq outlook ahead of US CPI and earnings season interpretations. Key support, resistance, and breakout levels as US-Iran tensions drive market volatility.
Written by
Razan Hilal
Market Analyst
US-Iran tensions continue to reinforce geopolitical risk premiums, limiting risk appetite ahead of the US CPI report, the Federal Reserve's policy guidance, and the start of the US earnings season.
US CPI is expected to decline from 4.2% toward 3.8%, broadly in line with the sharp decline in crude oil prices from their yearly highs. However, market expectations regarding the implications of the latest US-Iran escalation are likely to remain the primary driver of price action across major asset classes.
Following the collapse of the ceasefire framework, the US and Iran have once again exchanged strikes, with tensions continuing to escalate around the Strait of Hormuz. As geopolitical risks intensify, capital has flowed toward the US dollar and crude oil, while capping recoveries across equities, cryptocurrencies, precious metals, and major currencies.
Risk Sentiment on Hold?
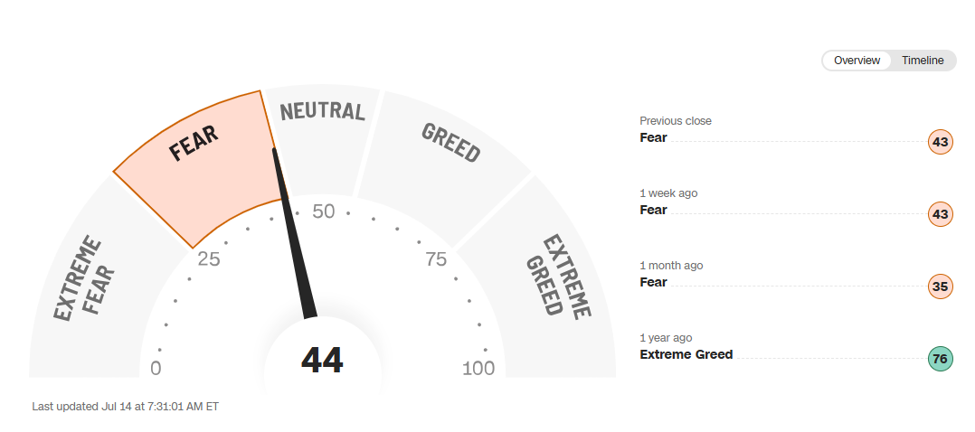
Source: CNN
As markets digest today's US CPI report, the Federal Reserve's policy signals on Wednesday, and forward guidance from upcoming US earnings reports, a directional breakout across major asset classes is expected to emerge.
Key markets remain at critical technical levels:
- The US Dollar Index (DXY) is testing the 101.80 resistance level, a key barrier ahead of a potential bullish breakout.
- Gold is holding above a major historical support zone, aligned with a 10-year ascending trendline and the 27.2% Fibonacci retracement of the 1920-2026 advance.
- The Nasdaq continues to consolidate within a narrowing triangle pattern as investors await this week's key catalysts.
- Bitcoin is also holding a fragile rebound, similar to the recent price action observed in gold and silver.
I discussed these charts in the biweekly webinar
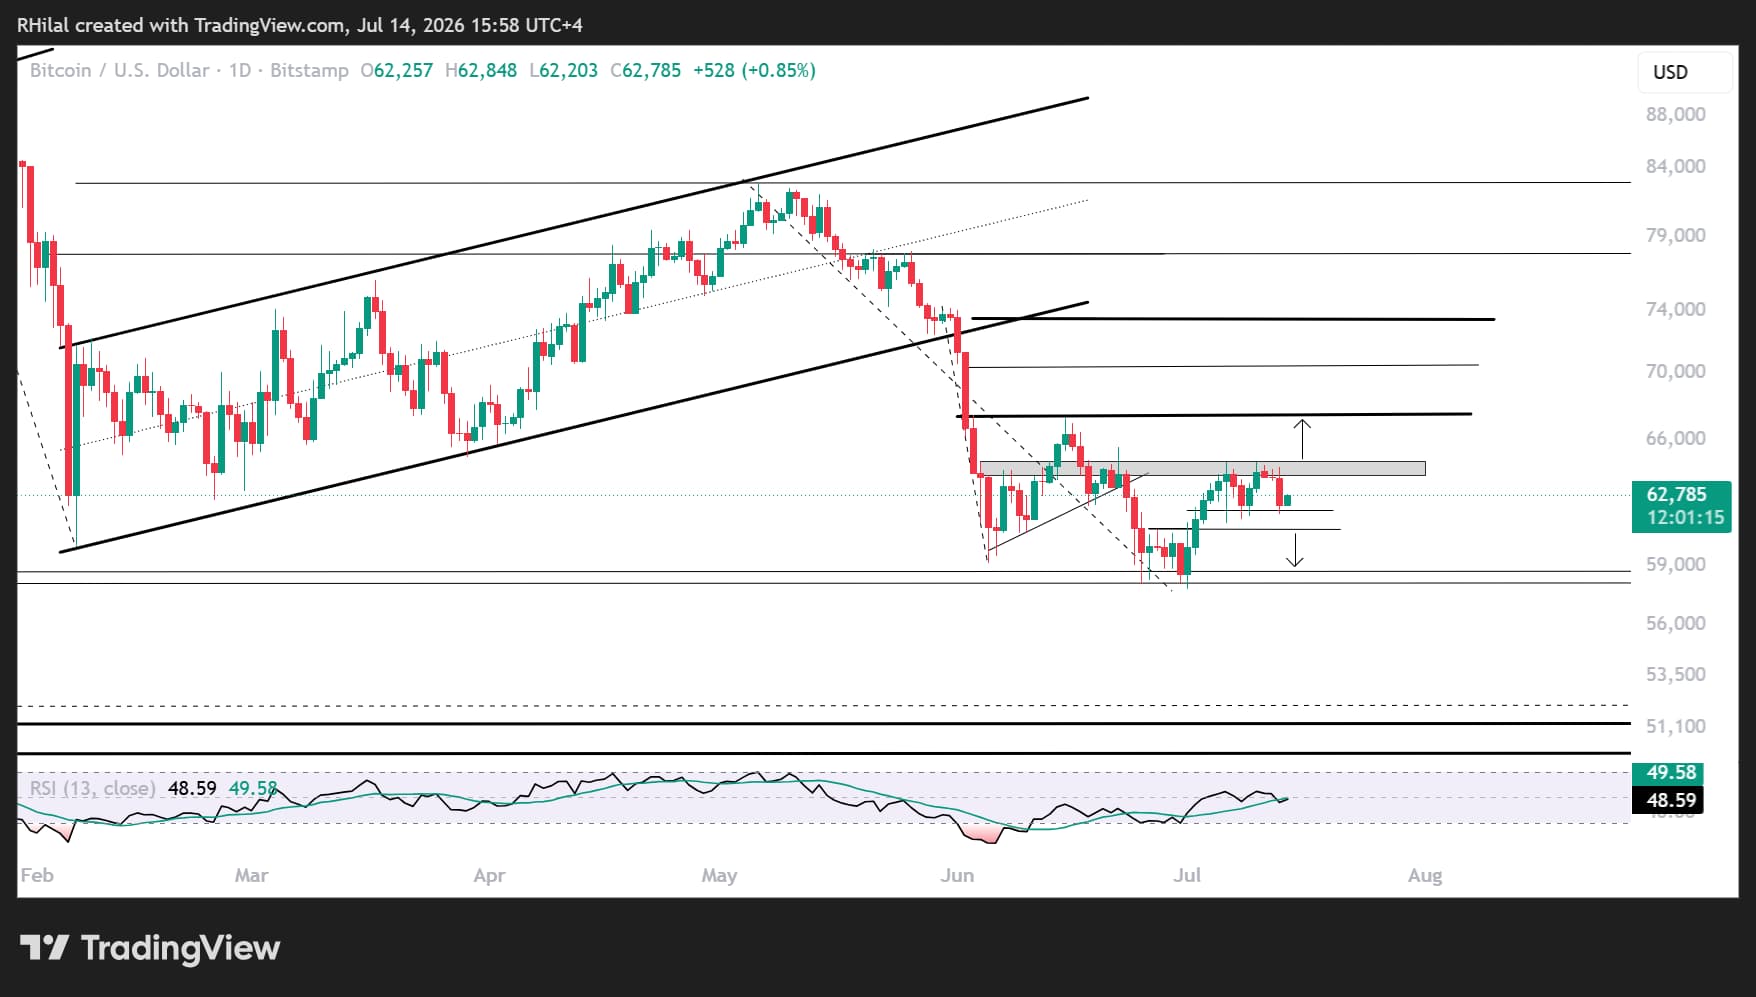
Bitcoin Price Outlook: Daily Time Frame – Log Scale
Source: TradingView
Bitcoin's fragile rebound from the $58,000 low remains capped below the $65,000 resistance after two consecutive rejections, increasing the risk of a short-term double-top formation.
Bullish Scenario
A breakout above $65,000, which aligns with the 27.2% Fibonacci retracement of the May-July 2026 decline, would shift focus toward:
- $67,000 – 38.2% Fibonacci retracement.
- $70,000 – 50% Fibonacci retracement.
- $74,000 – 61.8% Fibonacci retracement and the key technical level separating the current bearish bias from a renewed bullish trend.
Bearish Scenario
A breakdown below the $61,000 neckline would expose the yearly lows near $58,000 once again. A sustained break lower could extend losses toward the $49,000-$50,000 region, corresponding to the August 2024 lows and a potential long-term dip-buying opportunity.
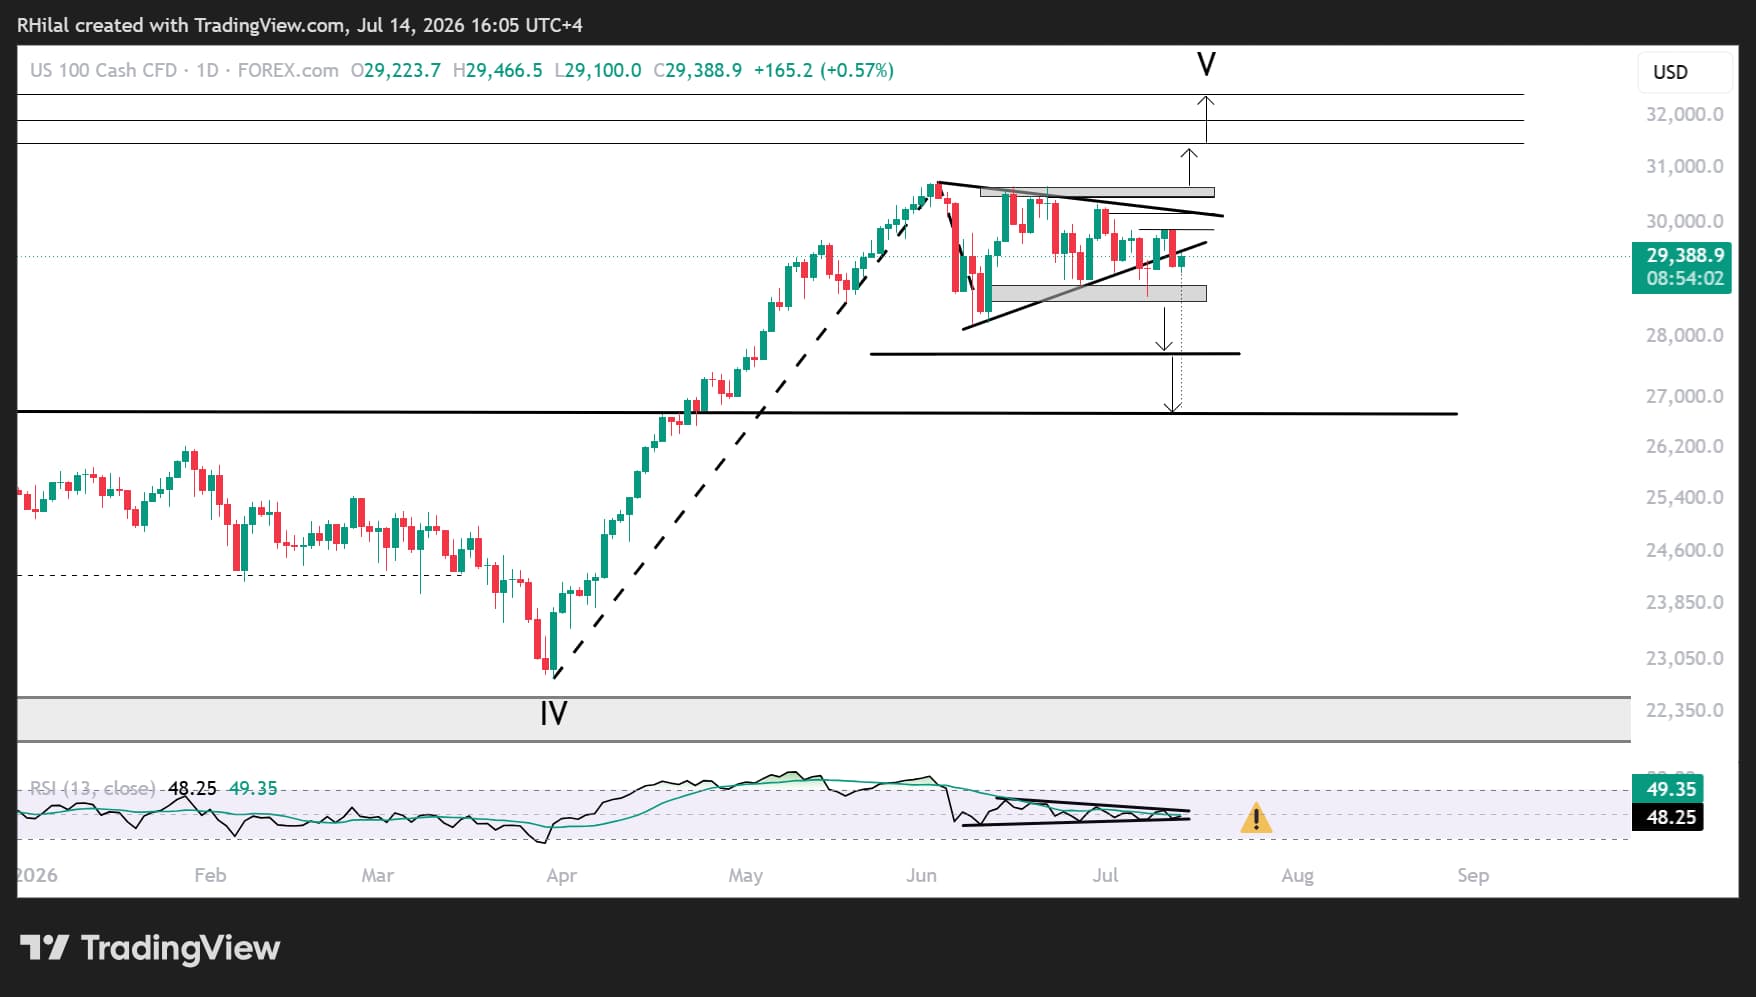
Nasdaq Price Outlook: Daily Time Frame – Log Scale
Source: TradingView
The Nasdaq's prolonged consolidation in both price action and momentum continues to provide a well-defined framework for the next directional breakout. Current price action, momentum, and chart structure all remain broadly neutral while the triangle pattern continues to narrow.
Bullish Scenario
A breakout above the 29,800-30,100 resistance zone would expose the upper boundary of the triangle near 30,400-30,600. This remains the primary resistance area that will determine whether the Nasdaq continues consolidating or breaks out toward fresh record highs, potentially extending the rally by more than 1,000 points.
Bearish Scenario
A breakdown below the 29,000 level would expose the key support zone between 28,800 and 28,600. This area could either trigger another rebound and prolong the consolidation or lead to a deeper correction toward the Fibonacci retracement levels of the March-June advance:
- 28,600 – 27.2% Fibonacci retracement.
- 27,700 – 38.2% Fibonacci retracement.
- 26,700 – 50% Fibonacci retracement, a high-probability rebound zone as price action approaches the former resistance trendline connecting consecutive highs between 2025 and 2026, which may now act as major support.
AI chip manufacturers and broader technology sector earnings, together with forward guidance on monetary policy and Treasury yields returning toward their yearly highs, are likely to dictate the next major move in equities. This will be particularly important as crude oil prices return toward the $80 mark while uncertainty surrounding the US-Iran conflict and the Strait of Hormuz remains unresolved.
Written by Razan Hilal, CMT
Follow on X: @Rh_waves







Web Trader platform
Our sophisticated web-based platform is packed with features.
Open an account today
Experience award-winning platforms with fast and secure execution.
Economic calendar
Related articles

Euro Short-term Outlook: EUR/USD Pullback Nears Pivotal Uptrend Support 8 28 2026
Warsh's comments accelerated the EUR/USD selloff, raising the stakes as buyers look to stabilize the broader recovery.


Nasdaq 100 Forecast: NDX slips ahead of Fed Chair Warsh’s speech
U.S. stocks are edging lower on Friday, giving back some of yesterday's gains after Nvidia's strong outlook revived the tech trade. The focus has now shifted firmly to Fed Chair Kevin Warsh's Jackson Hole speech, with investors looking for more clarity on the outlook for interest rates.


AUD/CAD breakout puts the Bradman barrier in sight
A bullish breakout has pushed AUD/CAD to its highest level since early 2021. Whether it can clear 0.9994 may determine if the move extends well above parity.
