

Bitcoin Breaks Out in a Big Way as Anti-Dollar Flows Shift from Gold
The delayed fuse between BTC/USD and Gold was lit this week and BTC/USD is now working on its strongest week since last September with a current 14.2% gain.
Written by
James Stanley
Sr. Strategist
BTC/USD Talking Points:
- The $65k level was hard resistance that gave bulls difficulty over a few different tests, but that’s now in the rearview following a massive breakout on the back of increased Treasury buybacks.
- I had written about this on Monday, highlighting the bullish structure in Bitcoin as a higher-low support hold led to another push towards that $65k level. Now buyers are in the driver’s seat as BTC/USD is approaching its strongest weekly outing since last September before the 125k top was set.
While much of the world likes to equate Bitcoin and Gold as being anti-dollar competitors, the reality is timing in the two markets is often quite different. I highlighted this on Monday, how there’s been a tendency for gold to lead the way higher and then for Bitcoin to take over on more than one occasion. This was a big part of the Covid boom in the summer of 2020, when Gold found resistance at $2k in August of that year and, at the time, Bitcoin was vying to get back above the $12k marker. Of course, Gold then ranged for three-plus years as BTC/USD went through multiple cycles, eventually setting a high at $69k.
Another episode appeared around the second election win of Donald Trump, who courted the crypto crowd quite clearly ahead of his November win. About a week before that, with Trump ahead in the polls, Gold prices calmed and pulled back after a near 40% run in the prior seven months. Bitcoin then got bullish in a very big way and once again, as Gold prices calmed BTC/USD went vertical.
More recently, however, BTC/USD has been on its back foot, even as Gold put in another significant rally late last year. So, when Gold came to life again a few weeks ago following the FOMC meeting and the BoJ intervention, it seemed there was little expectation that BTC/USD would follow.
But – as I highlighted two weeks ago the bullish structure in Bitcoin was still there, and the cryptocurrency had held higher-lows at a significant spot and that kept the door open for an eventual re-test and then break of the $65k handle, and that’s what’s panned out over the past 24 hours.
BTC/USD Daily Chart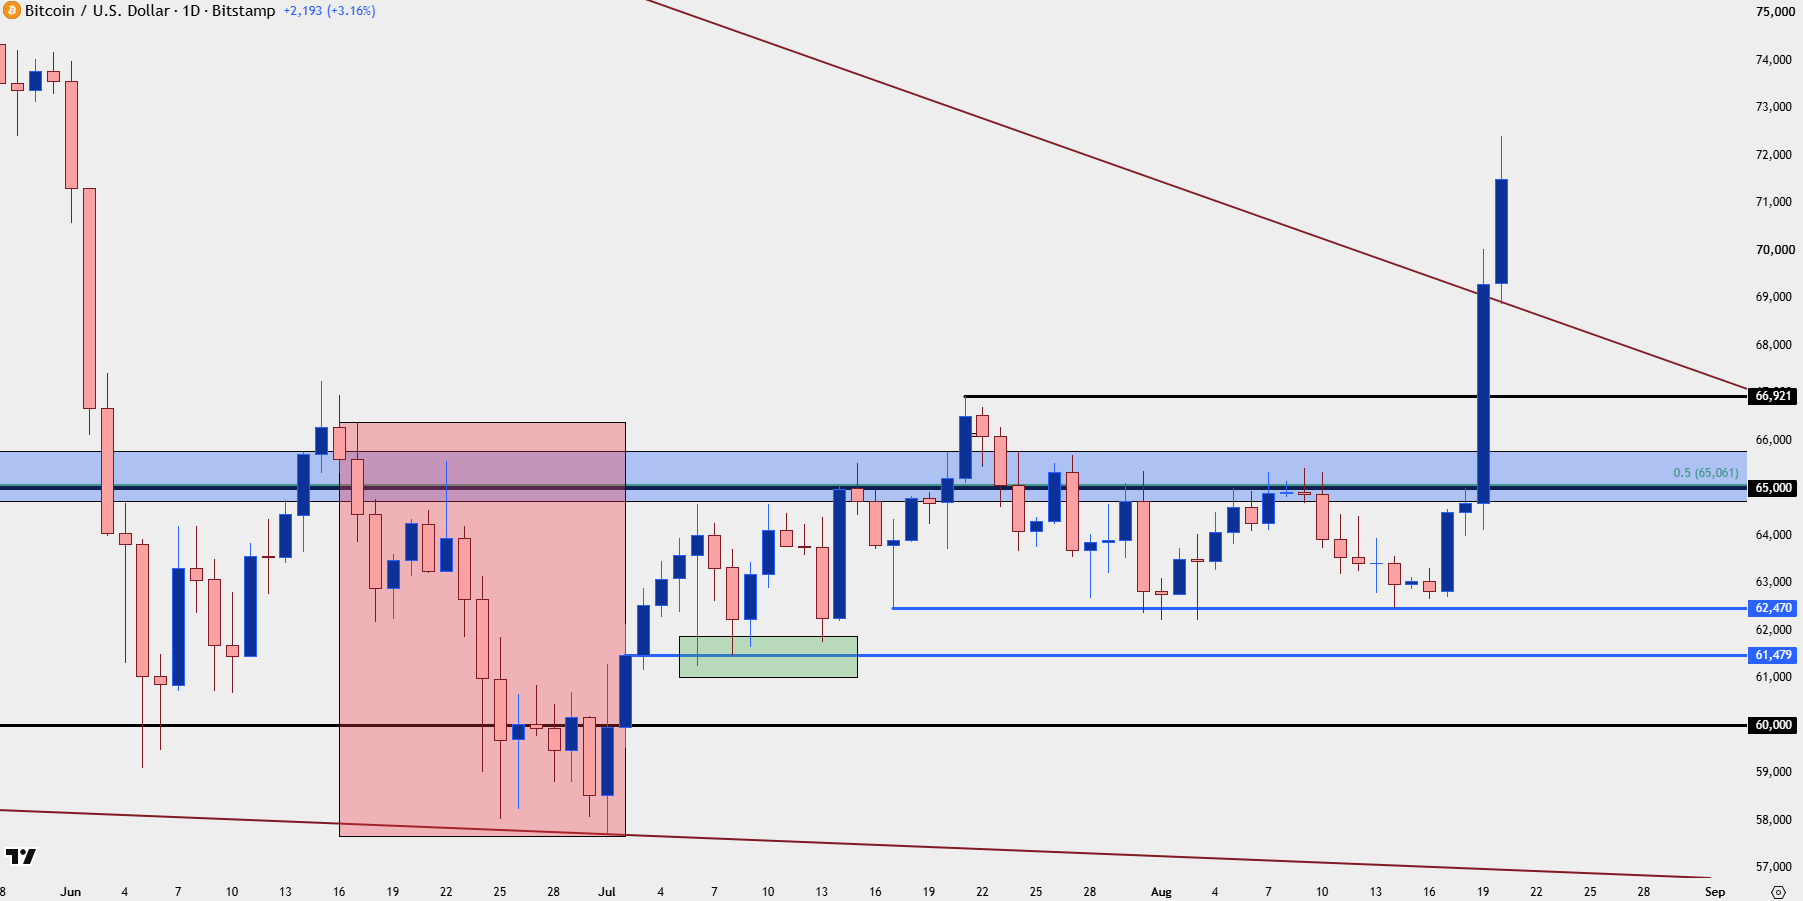
Chart prepared by James Stanley; data derived from Tradingview
BTC/USD – Has the Train Left the Station?
The complication now is just how aggressive the move priced-in, and with such a rally into a new trend there was likely a lot of short squeezing taking place. But traders without positions are now faced with an unenviable set of choices: Either chase an overbought move or wait and see if it pulls back to allow for entry into a fresh bullish trend. To be clear, neither is perfect and only time will tell which is optimal. But, for the trader, the choice is essentially to yield to excitement or risk missing the boat, and only one of those choices comes with the assurance of lost capital in unfavorable scenarios.
The big picture hope – given the current structure there’s now a fresh breakout in Bitcoin from the weekly chart, as price is pushing through the top of a falling wedge formation. If that’s to continue, then there should be a new trend to follow, which could allow for entry or re-entry on pullbacks, if that new theme is to come to pass.
BTC/USD Weekly Chart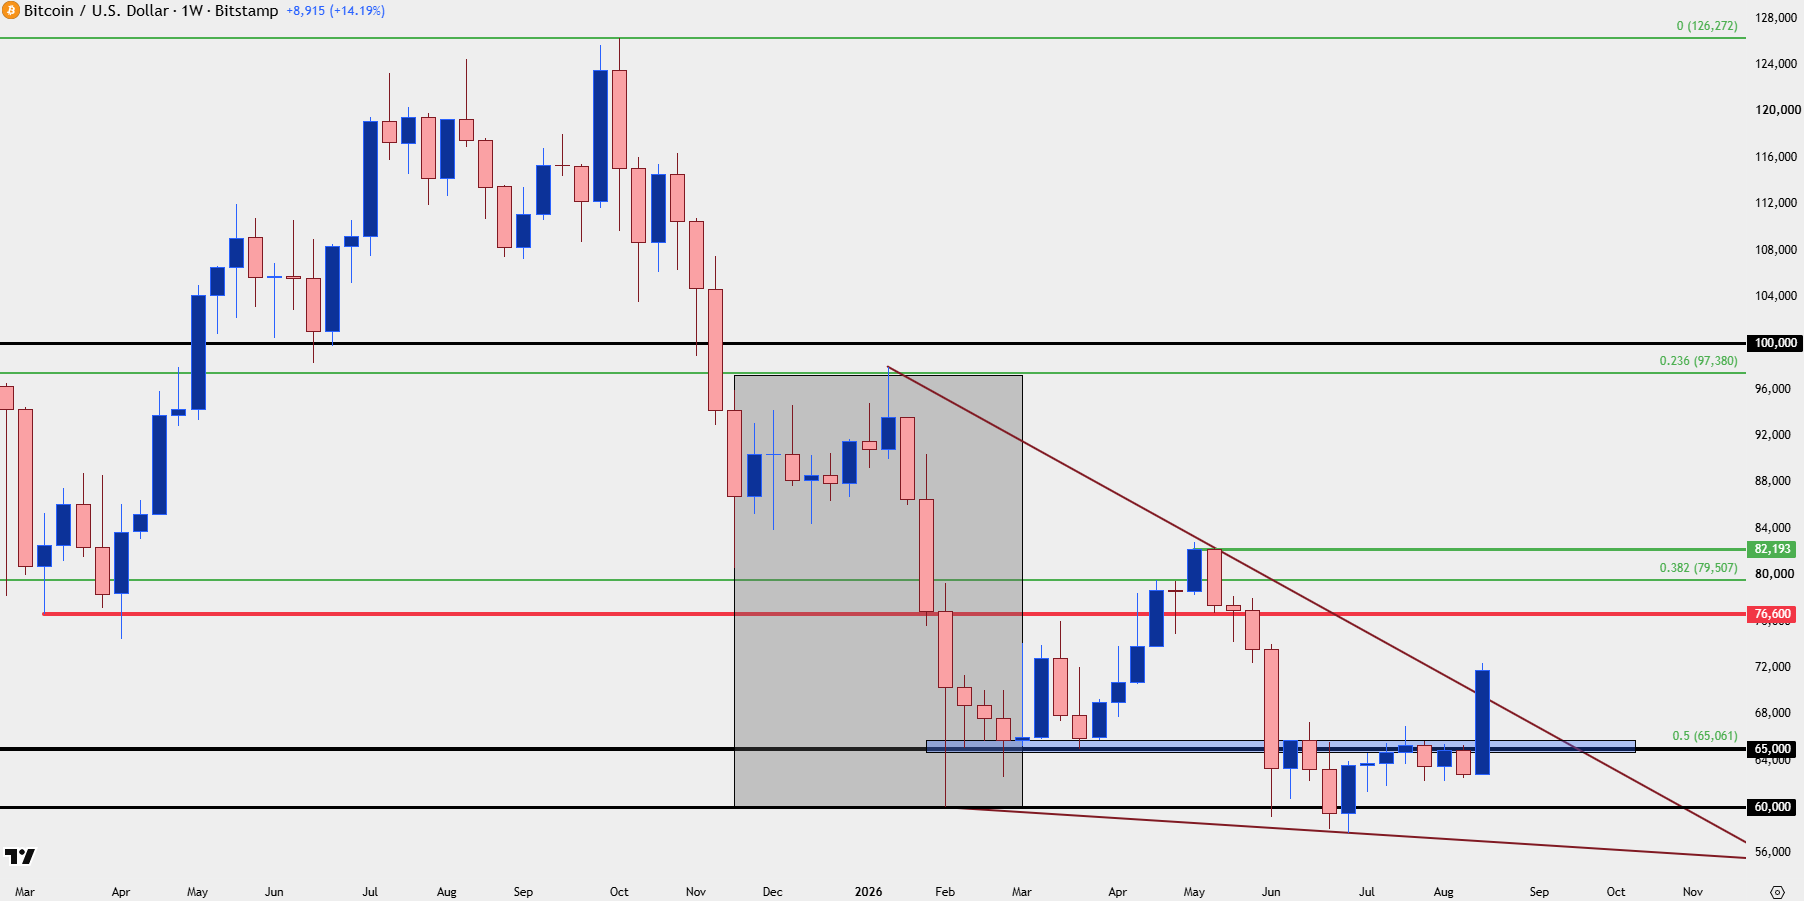
Chart prepared by James Stanley; data derived from Tradingview
BTC/USD Shorter-Term
Another reason that I think this move is at least partially fueled by a short squeeze is the dynamics behind price action, as each recurrent test of resistance has been met by a strong extension of the move. And there’s been a big jump at both 65k and 70k, so stops on short positions sitting at or just above those thresholds become another jolt of demand when price triggers execution.
At this point, the rally has stalled at a prior swing low, just inside of 72,500. And for this to be a ‘healthy’ trend, we should see some profit taking given the massive leap, which sets up for the possibility of a 70k re-test, and below that, the prior resistance at 67k also jumps out as important.
While the 70k level might seem like a stretch from where we’re at now, it’s right around a 23.6% retracement of the rally from this week alone, so that sets up for an attractive spot for bulls to defend in that profit taking scenario.
BTC/USD Four-Hour Chart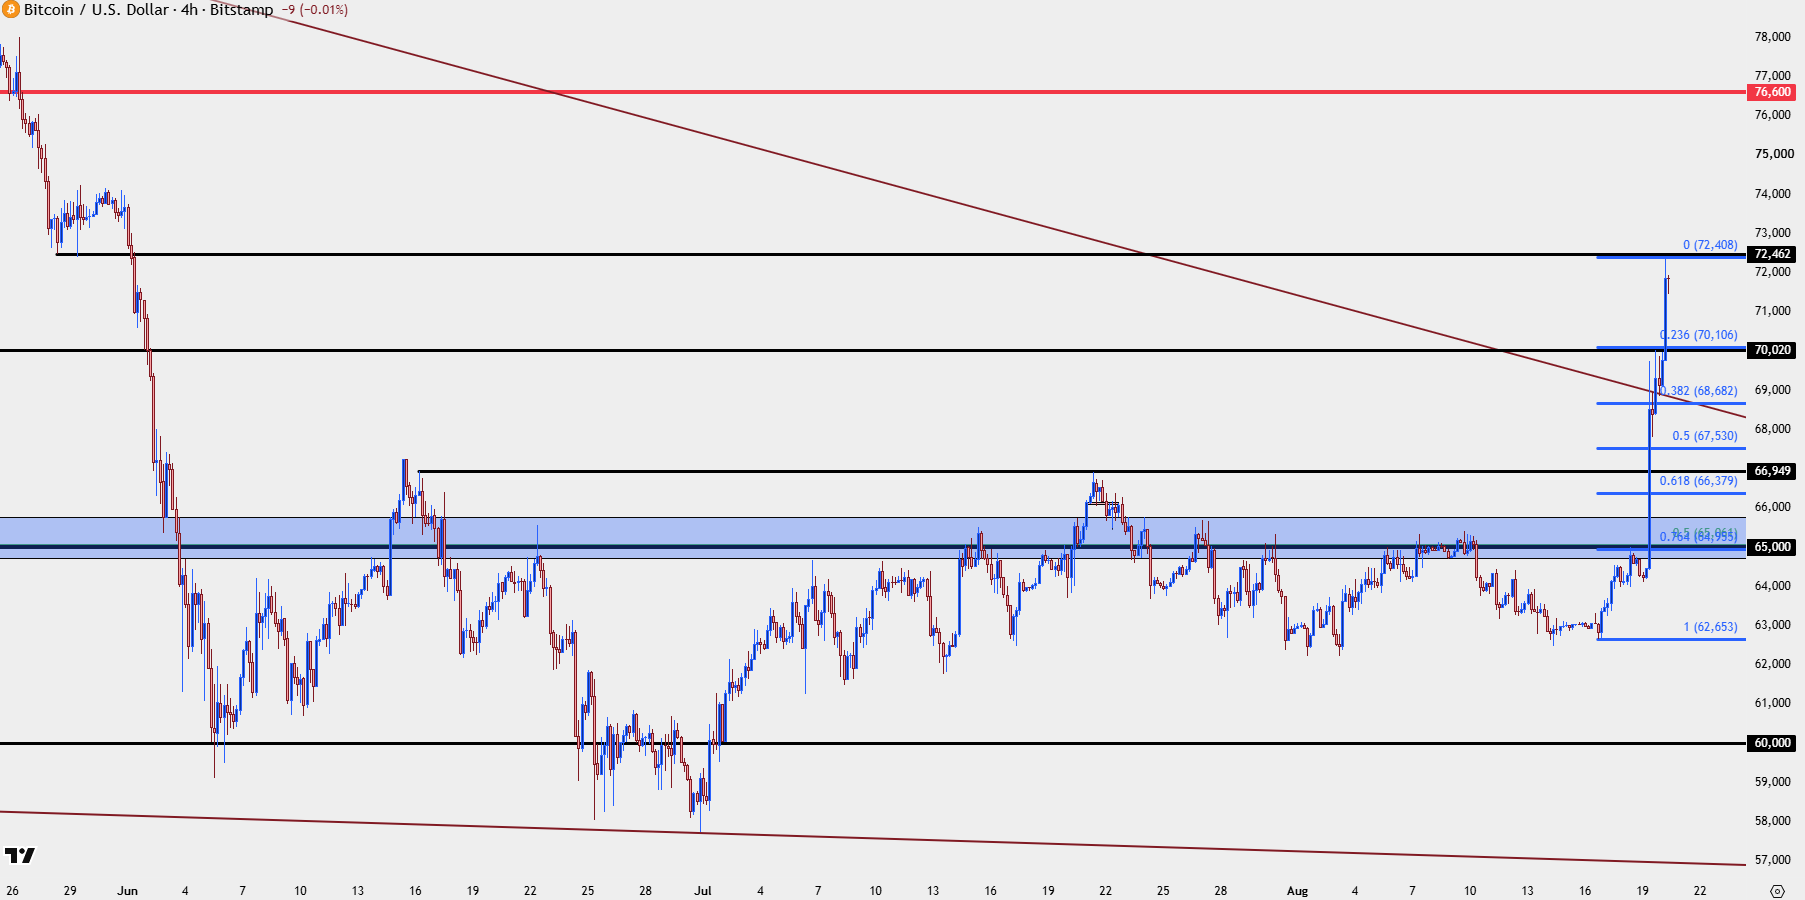
Chart prepared by James Stanley; data derived from Tradingview
--- written by James Stanley, Senior Market Analyst, Global Macro
Related tags:







Web Trader platform
Our sophisticated web-based platform is packed with features.
Open an account today
Experience award-winning platforms with fast and secure execution.
Economic calendar
Related articles

Bitcoin Forecast: BTC/USD Back to $80K Ahead of Warsh’s Jackson Hole Speech
After surging over $15,000 in the past 10 days alone, there is risk of a near-term pullback if Warsh says anything remotely hawkish at Jackson Hole - what are the levels to watch from here?


Bitcoin’s failed breakouts are becoming hard to ignore
Three failed breakout attempts and fading momentum have put Bitcoin bulls on notice. Another rejection could open the door lower just as attention swings back towards NVIDIA and the AI trade.


US Dollar, Gold & Bitcoin Weekly Technical Outlook 8 24 2026
Key levels on active technical setups in DXY, Gold, and Bitcoin heading into the start of the week.
