

Gold Calms but Bitcoin Jumps – Which Anti-Dollar Will Take Over?
The Gold breakout continues to digest but the bigger move today is an alternative market as Bitcoin is working on its strongest daily outing in two months.
Written by
James Stanley
Sr. Strategist
Gold, Bitcoin Talking Points:
- While measuring the USD against other currencies such as the Euro or Japanese Yen can be deceiving, measuring those fiat currencies against other asset classes such as gold or bitcoin can be informative.
- With a massive glut of Treasuries coming due in the next year there’s going to be large supply hitting along the maturity curve of USTs. So holding Treasuries particularly with duration isn’t exactly attractive right now, to either hedge funds or central banks. That’s at least part of the push towards long gold and this could, perhaps, even have drive into cryptocurrencies like Bitcoin.
- I looked into Bitcoin last week as the gold breakout was taking hold and the ‘s1’ support level has since held the lows, with bulls going towards another test of the $65k level.
The breakout in gold was a beautiful setup that saw the metal grasp at the $4k level for more than a month before bulls finally took a step forward two weeks ago. And they wasted little time, with higher-highs and lows developing to illustrate a bullish trend building, all the way until a key spot of resistance came back into the picture at the $4380 swing, taken from the resistance last October that came in as support in February and March.
That zone stalled the move last week and while bulls still have control shorter-term, this is a major waypoint that buyers need to overcome to present a compelling case of continuation potential. And while that’s happening, Bitcoin just came to life in a big way which I’ll look at below.
Gold Weekly Chart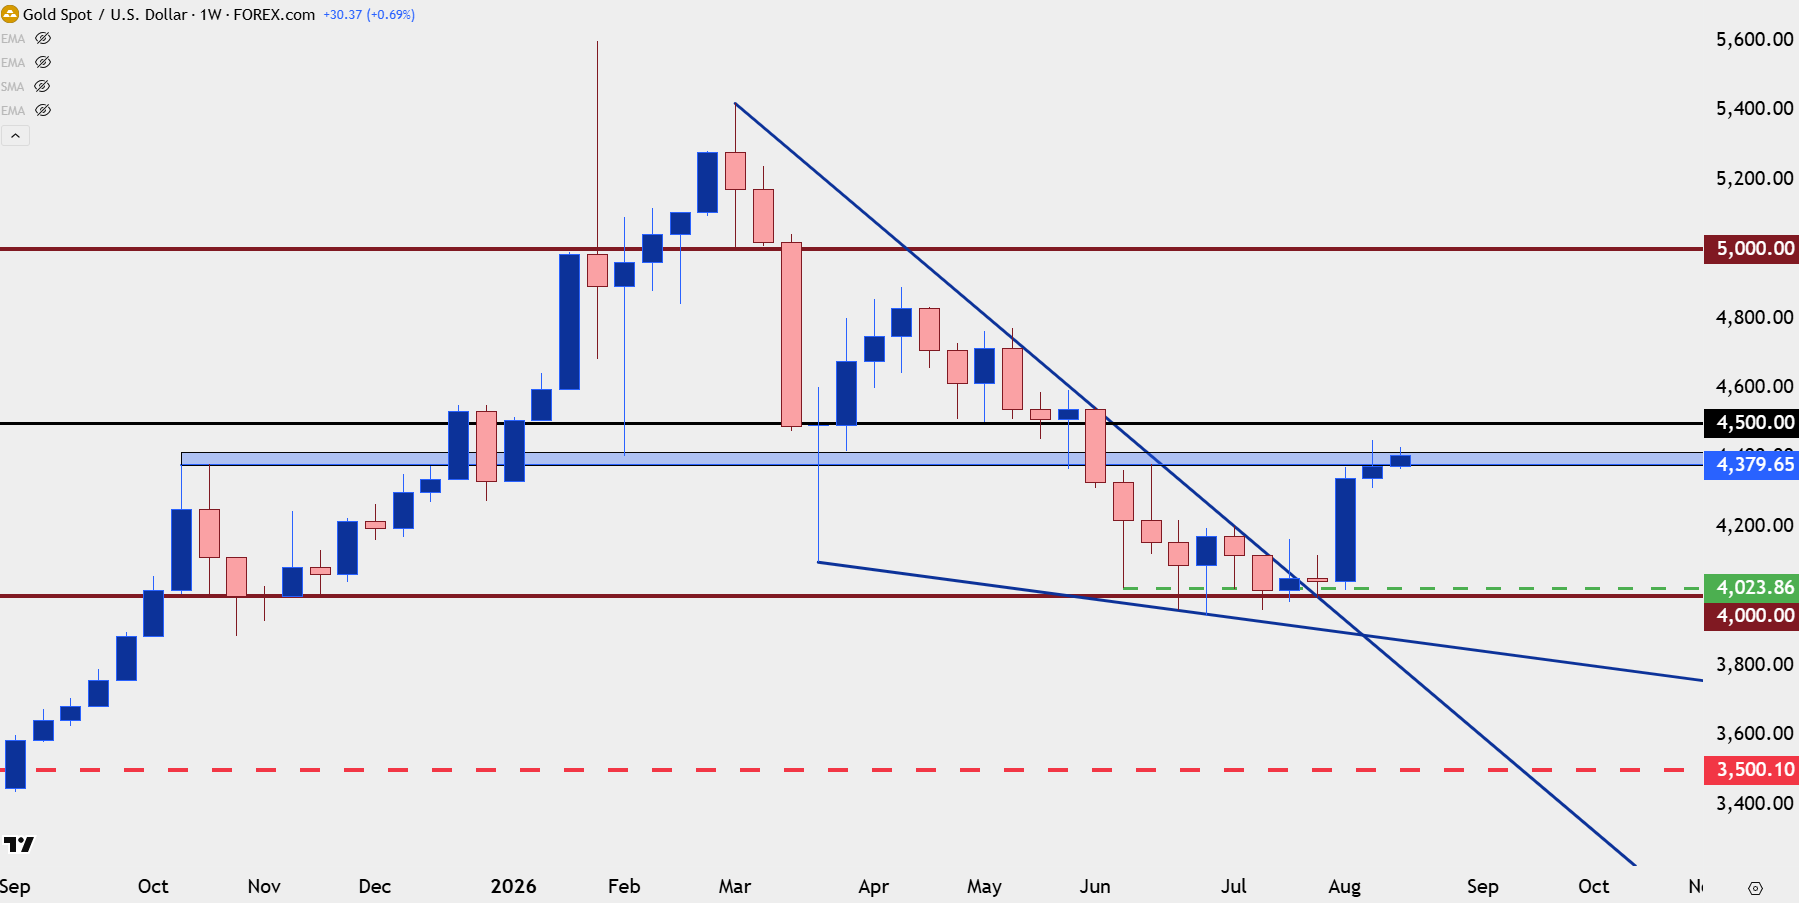
Chart prepared by James Stanley; data derived from Tradingview
Bitcoin Back in Action
I looked at this market last Monday, after BTC/USD seemingly failed to remain above the 65k level as the rally in gold was taking over.
But - as I highlighted there - the bigger question, like what we had in gold previously, was whether buyers come into show support at or around prior points of structure. The first support level shown in that article was the 62,470 level, and, so far, that’s what’s caught the low which came into play last Friday.
Since then, it’s been higher-lows and today sees bulls showing a strong hand with price re-approaching that 65k level. This sets up for another important test at the big figure that Bitcoin has struggled to stay above since the breakdown in June.
BTC/USD Daily Chart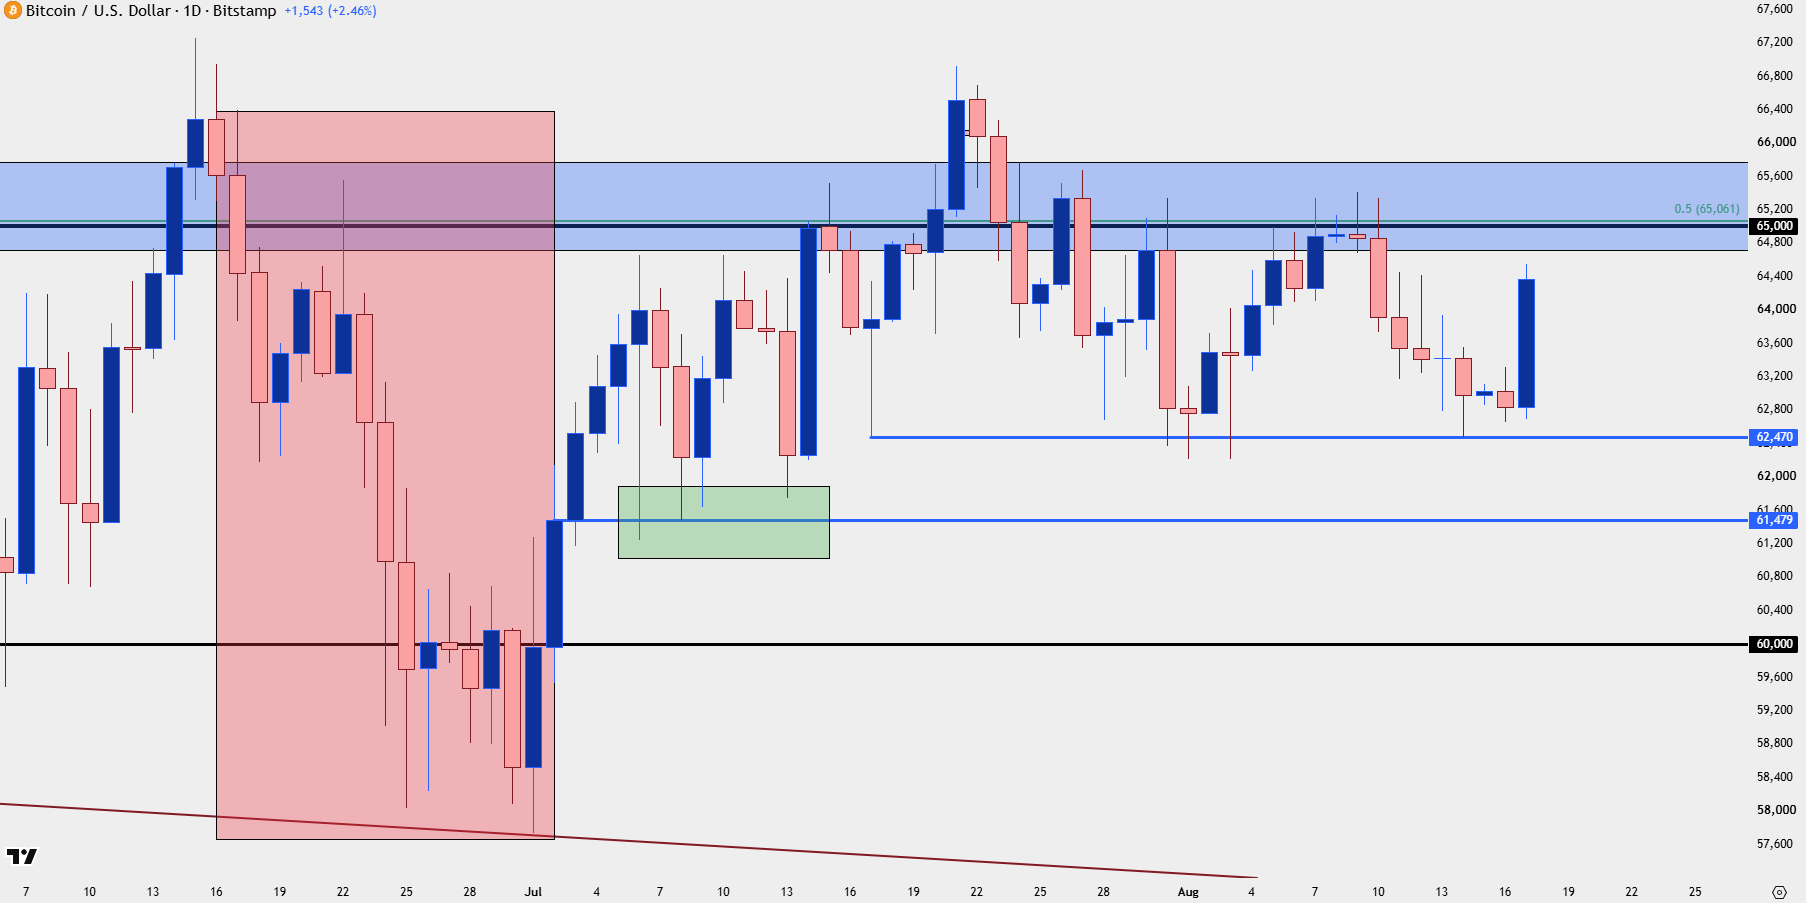
Chart prepared by James Stanley; data derived from Tradingview
Bitcoin Big Picture
The reason this backdrop is so important is what’s happening in the bigger picture of Bitcoin, which has seen progressively higher-lows holding since early-July when price tested below the 60k handle. This is similar to the backdrop in gold which took almost two months of support at $4k before finally breaking out – the fact that you can see underside wicks on the daily and a degree of anticipation from buyers coming in at higher-lows illustrates and increasing aggression that could, eventually, play out to a breakout and fresh near-term highs.
While that relationship has already built and is clear in gold, we’re not quite there in Bitcoin, as there’s also been lower-highs in June, July and so far in August. And this is why a continued rally above that 65k level is so important, as it signifies increasing tolerance for prices above the 65k level from buyers and, like the breakout at $4100 or $4200 in gold, that could be the early stage of a rally that could go on for a while.
Bitcoin Daily Chart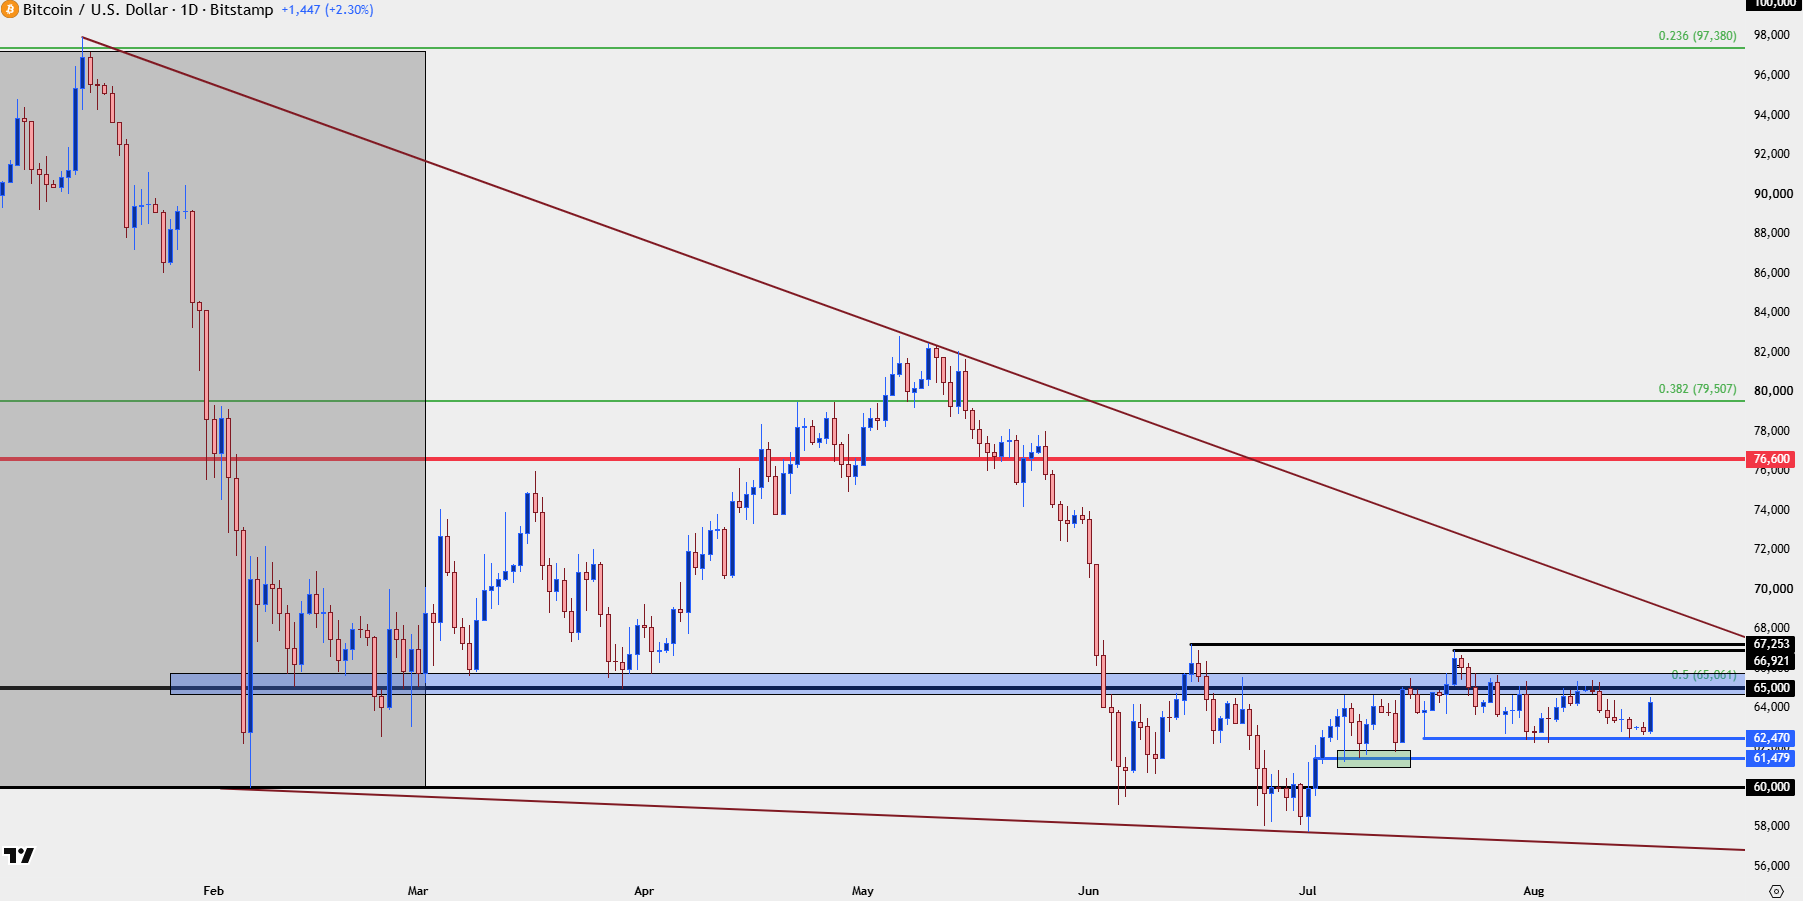
Chart prepared by James Stanley; data derived from Tradingview
Gold
While many want to look at gold and bitcoin with a degree of inter-changeability the fact is they’re different markets, and correlations can be tricky items. With Bitcoin especially, there’s the constant of small sample sizes which brings questions to things like the ‘four year cycle.’
But the episode in both the summer of 2020 and fall of 2024 illustrate how one market can go flat or sideways while the other takes over. In the first episode gold tagged $2k in August of 2020 and, at the time, Bitcoin was struggling to get back above the $12k level. For the next three-and-a-half years, gold ranged with $2k as an upper boundary. Bitcoin went through a couple of life cycles throughout, running as high as $69k before finally softening.
And then in 2024, gold rallied hard as the Fed cut even with inflation high, until about a week before the election. And at that point gold, once again, went into range and Bitcoin took over with a meteoric run that, eventually set the 125k high.
So, while the dynamics behind the idea and trade can be similar, gold and Bitcoin do not have to move lock-step, and they are very different markets so it makes sense as to why one might take the lead in front of the other.
At this point, however, gold is the market where bulls have advantage following the breakout and then last week’s defense of the $4300 area. The current line in the sand for resistance is $4435, which traded three times last week before the Friday pullback developed. And while above that is messy, the next logical spot to look for overhead resistance is that $4500 psychological level.
Gold Daily Chart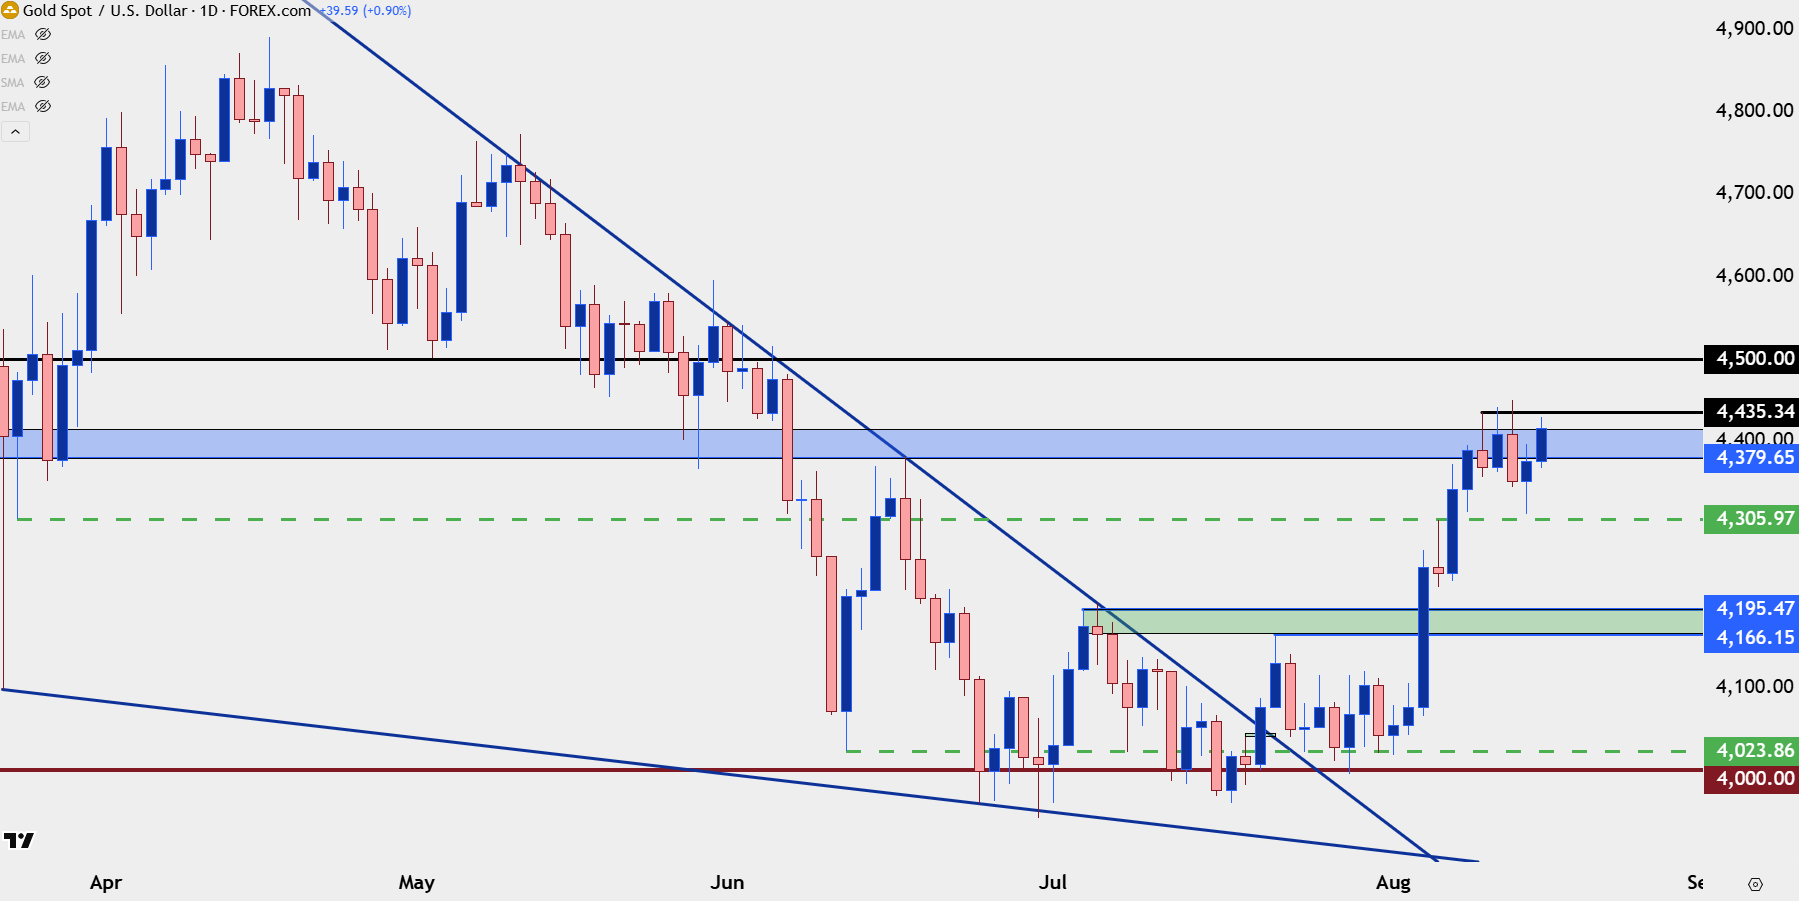
Chart prepared by James Stanley; data derived from Tradingview
--- written by James Stanley, Senior Market Analyst, Global Macro
Related tags:







Web Trader platform
Our sophisticated web-based platform is packed with features.
Open an account today
Experience award-winning platforms with fast and secure execution.
Economic calendar
Related articles

Gold and S&P 500 analysis: What now after Warsh’s hawkish speech?
The dollar surged across the board after the Fed Chair Kevin Warsh surprised with a hawkish-leaning speech at the Jackson Hole summit. All the bearish dollar bets that had been accumulated since last Friday on the back of data weakness and bond market troubles had to be squared and that triggered a short squeeze rally for the dollar. Gold and silver dropped, as a result, as too did bitcoin, while US indices were giving back earlier gains.


Nasdaq 100 Forecast: NDX slips ahead of Fed Chair Warsh’s speech
U.S. stocks are edging lower on Friday, giving back some of yesterday's gains after Nvidia's strong outlook revived the tech trade. The focus has now shifted firmly to Fed Chair Kevin Warsh's Jackson Hole speech, with investors looking for more clarity on the outlook for interest rates.


Bitcoin Forecast: BTC/USD Back to $80K Ahead of Warsh’s Jackson Hole Speech
After surging over $15,000 in the past 10 days alone, there is risk of a near-term pullback if Warsh says anything remotely hawkish at Jackson Hole - what are the levels to watch from here?
