


Bitcoin, Dow Jones Outlook: Dow Tests Major Resistance and Bitcoin Lags Below $67,000
Bitcoin, Dow Jones Outlook: Bitcoin remains below $67,000 while the Dow Jones tests major multi-year resistance. Key technical levels that could determine the next market move.
Written by
Razan Hilal
Market Analyst
Bitcoin continues to trade below the $67,000 mark despite this week's broad risk-on rally, while the Dow Jones Industrial Average tests a major four-year resistance zone near 54,700, raising questions over whether the current rally can extend or is nearing a period of consolidation.
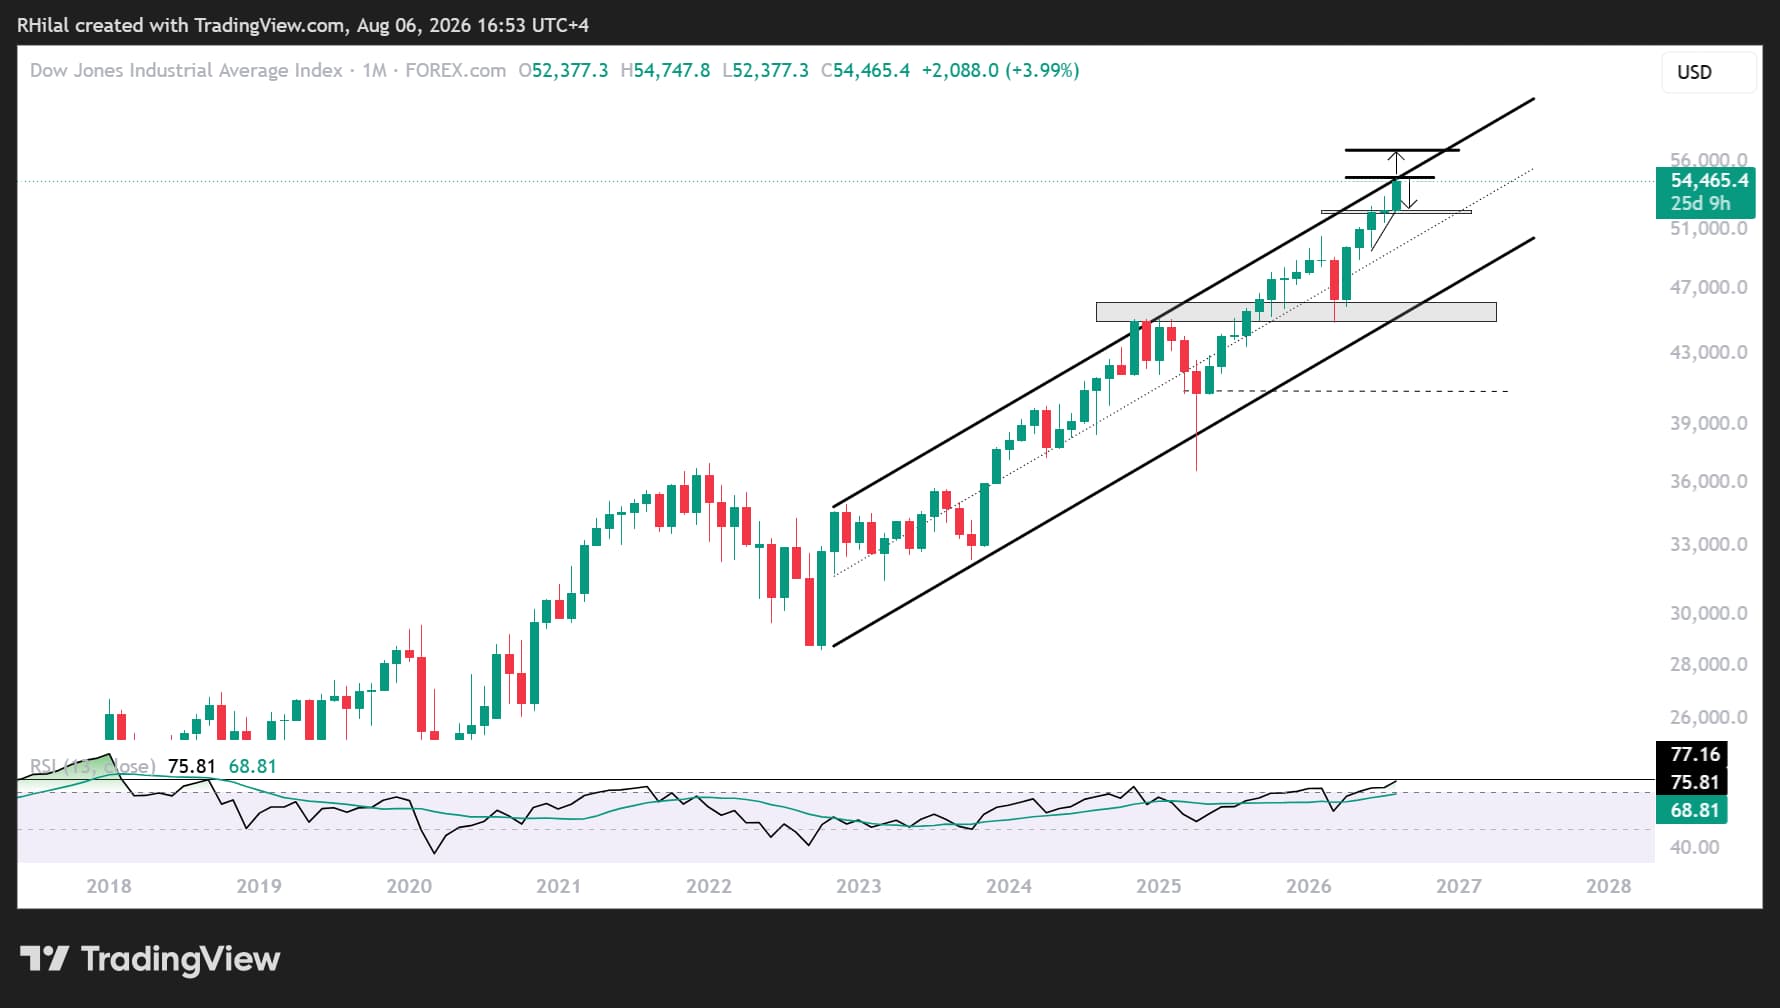
The Dow Jones was the first major US equity index to lead this week's rally, driven by optimism surrounding a potential US-Iran agreement. However, the index is now testing the upper boundary of its four-year ascending channel while monthly momentum has reached overbought levels last seen in 2018, increasing the risk of a near-term pullback.

A sustained break and close above the 54,700–55,000 resistance zone would instead reinforce the long-term bullish outlook, turning the upper boundary of the ascending channel into a new area of support and opening the door for another leg higher.
Dow Jones Outlook: Monthly Time Frame – Log Scale
Source: TradingView
Both the weekly and monthly charts suggest that upside momentum is becoming increasingly stretched, with price currently aligning with:
- The upper boundary of the ascending channel that has guided price action since 2022.
- The 100% Fibonacci extension of the April 2025 – January 2026 – March 2026 advance, located near 54,700.
From a fundamental perspective, optimism surrounding a potential US-Iran agreement has improved market sentiment, but no lasting framework has yet been established. As a result, geopolitical risk premiums remain embedded in financial markets, leaving the current rally vulnerable unless the Dow secures a decisive breakout above 55,000.
Should a pullback develop, the August low near 52,400 represents the next major support level, aligning with the 23.6% Fibonacci retracement of the March-August advance.
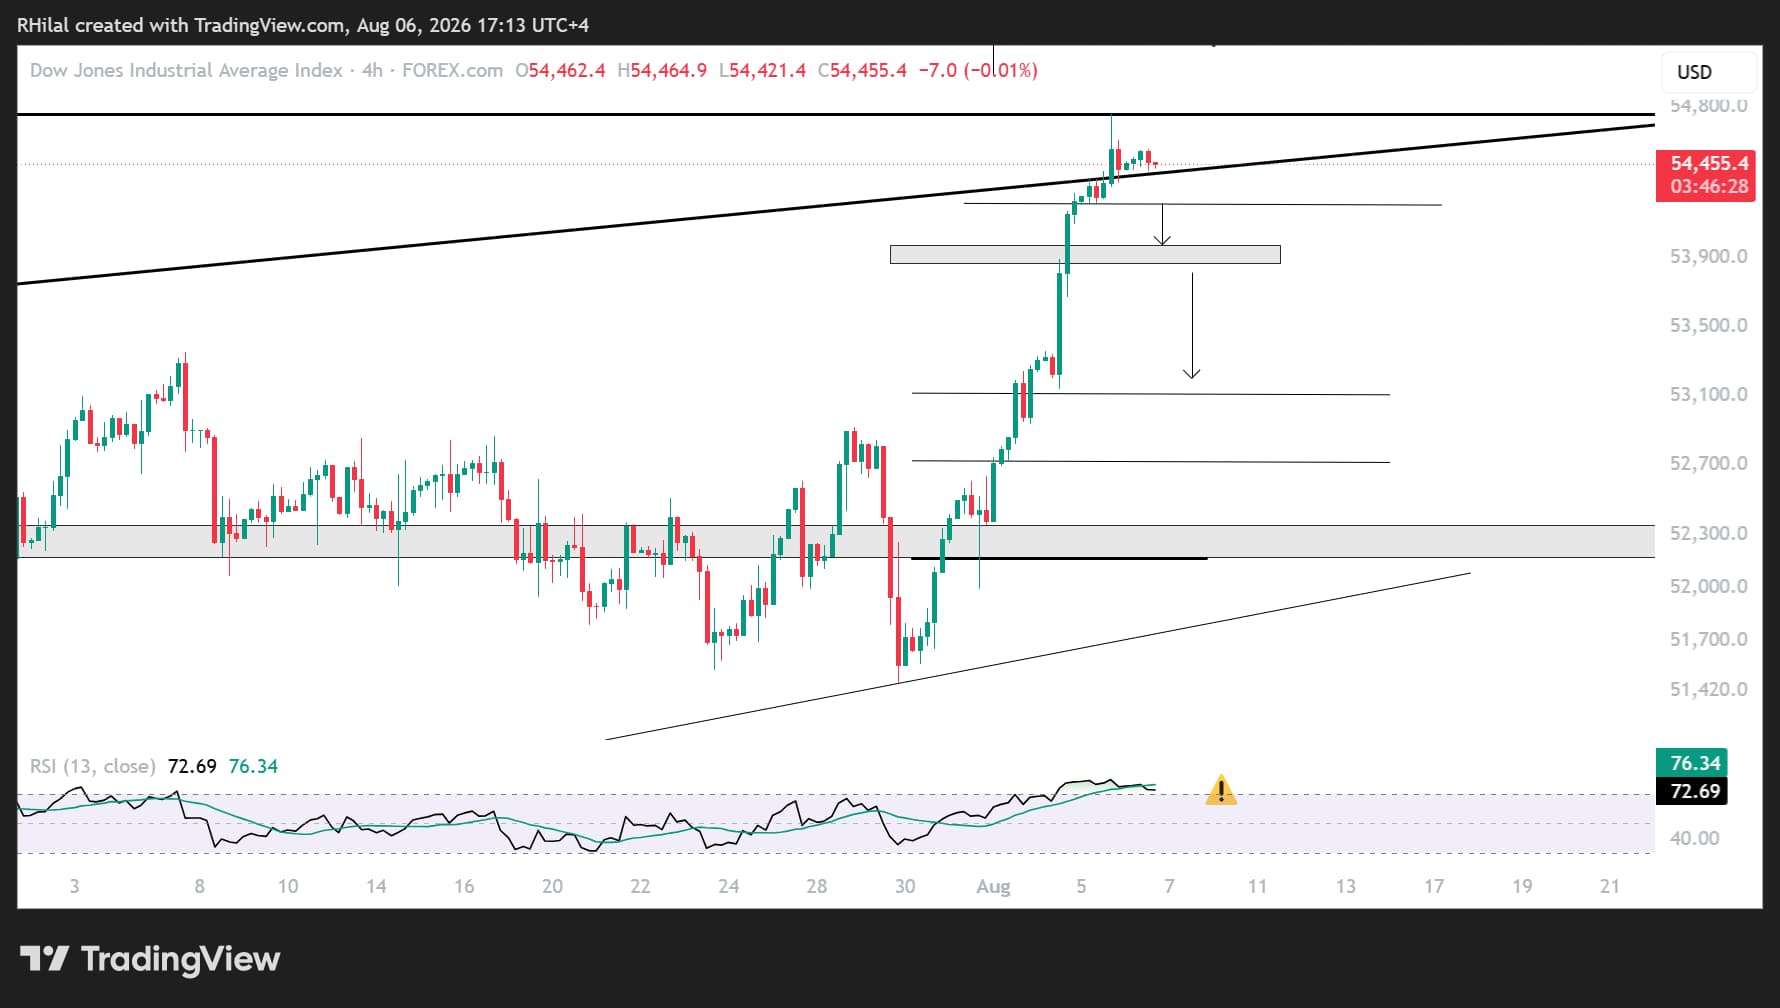
Short-term support levels are highlighted in the 4-hour chart below.
Dow Jones Outlook: 4-Hour Time Frame – Log Scale
Source: TradingView
On the four-hour chart, a clear bearish RSI divergence has emerged, suggesting that upside momentum is beginning to weaken.
A confirmed break below 54,200 would expose the psychological 54,000 level, followed by additional downside targets at 53,800, 53,200, 52,700, and ultimately 52,300.
These levels align with key Fibonacci retracement ratios of the July-August advance and could present attractive dip-buying opportunities before the broader uptrend has a chance to resume.
Bitcoin Remains the Missing Piece
Despite the strong rally in US equities, several intermarket signals suggest that investors continue to price geopolitical uncertainty. These include:
- The US Dollar Index (DXY) holding above its 2026 uptrend support near 99.30. DXY analysis
- WTI crude oil remaining above $70 per barrel.
- Bitcoin continuing to trade below the $67,000 resistance level and within the June-August consolidation, instead of confirming the broader risk-on move.
Together, these signals suggest that caution remains warranted unless the dollar and crude oil continue to weaken while Bitcoin begins to confirm improving risk appetite.
Bitcoin Outlook: Weekly Time Frame – Log Scale
Source: TradingView
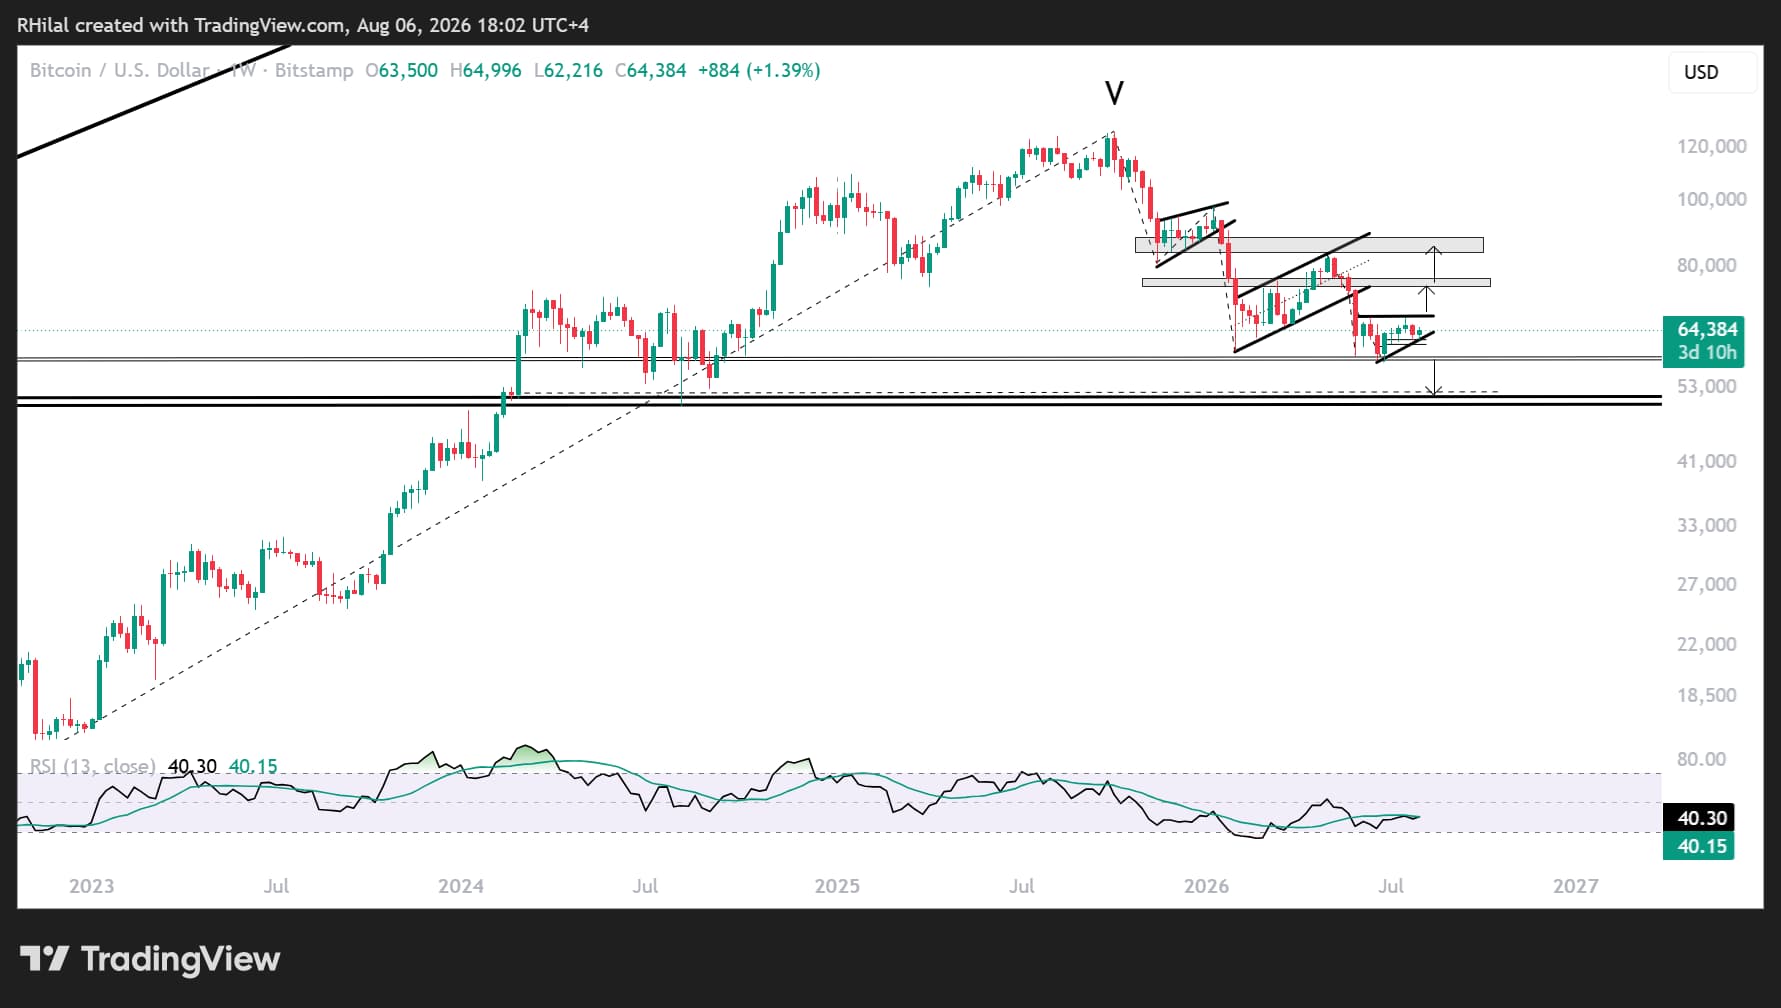
Bitcoin continues to trace a technical structure similar to that seen in precious metals, silver and gold, developing a contracting consolidation pattern near its 2026 lows between June and August.
A breakout above the upper boundary of this consolidation, above $67,000, would confirm strengthening risk sentiment and expose the first upside objective near $77,000, followed by $88,000. The latter represents a major long-term resistance level, aligning with the 27.2% Fibonacci retracement of the 2025-2026 decline and serving as an important dividing line between a long-term bullish and bearish outlook.
Conversely, failure to break above $67,000 would leave Bitcoin vulnerable to another decline. A confirmed break below the $60,000-$58,000 support zone would expose the $49,000-$50,000 region, near the August 2025 lows, where another long-term accumulation opportunity may emerge.
For now, Bitcoin's consolidation appears to represent a lagging accumulation phase awaiting broader confirmation that the recent improvement in global risk sentiment is becoming more sustainable.
Written by Razan Hilal, CMT
Follow on X: @Rh_waves







Web Trader platform
Our sophisticated web-based platform is packed with features.
Open an account today
Experience award-winning platforms with fast and secure execution.
Economic calendar
Related articles

Canadian Dollar Forecast: USD/CAD Weekly Reversal Puts Yearly Uptrend Back in Focus 8 29 2026
USD/CAD has staged its strongest weekly advance since June, shifting the focus to whether a more durable low is finally taking shape.


USD/JPY weekly outlook: Payrolls may challenge the Fed’s hawkish reset
USD/JPY has finally woken from its slumber. Payrolls now loom as the key test of whether the latest hawkish repricing sticks or sinks.


Euro Short-term Outlook: EUR/USD Pullback Nears Pivotal Uptrend Support 8 28 2026
Warsh's comments accelerated the EUR/USD selloff, raising the stakes as buyers look to stabilize the broader recovery.