


Bitcoin Price Forecast: BTC/USD 30% Selloff Tests Major Support—Bottoming Risk Builds 6 25 2026
Bitcoin is testing critical support after a steep selloff, with BTC/USD showing early signs that downside momentum may be fading.
Written by
Michael Boutros
Sr. Technical Strategist
Bitcoin Technical Forecast: BTC/USD Weekly & Daily Trade Levels
- Bitcoin is now down more than 54% from its record high and nearly 30% from the May peak, trading at its lowest levels since September 2024.
- BTC/USD is testing a critical long-term support zone that could determine whether the broader selloff stabilizes or accelerates.
- Building RSI divergence suggests downside momentum may be fading, raising the threat of an exhaustion low.
- The correction is approaching a major technical inflection point where volatility and directional risk are likely to increase.
- A break lower would signal a more significant trend reversal and expose deeper downside targets, while a successful defense could set the stage for a broader recovery.
Bitcoin is testing a major long-term support zone after a nearly 30% decline from the May high, bringing BTC/USD into a critical technical inflection point. The selloff has carried price into the lower bounds of the yearly downtrend, but building RSI divergence suggests downside momentum may be starting to fade. The focus in the days ahead is on whether buyers can defend this support zone and spark a recovery attempt, or if a break lower opens the door to another accelerated leg of the decline. Battle lines drawn on the BTC/USD technical charts.
Review my latest Weekly Strategy Webinar for an in-depth breakdown of this Bitcoin setup and more. Join live on Monday’s at 8:30am EST.
Bitcoin Price Chart – BTC/USD Weekly
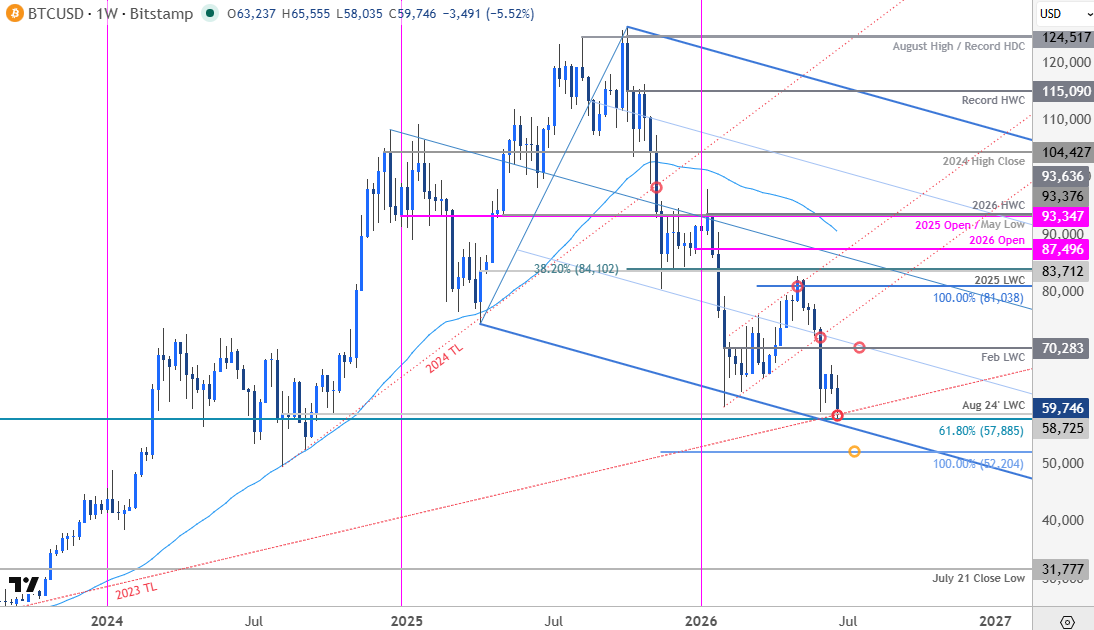
Chart Prepared by Michael Boutros, Sr. Technical Strategist; BTC/USD on TradingView
In last month’s Bitcoin Forecast we noted that BTC/USD was approaching uptrend support and that, “From a trading standpoint, losses would need to be limited to 70,283 for the February uptrend to remain viable…” Bitcoin broke lower the week with a decline of nearly 30% from the May high now testing a critical support zone noted in our 2026 trade of the yearly at 57,885-58,725- a region defined by the 61.8% retracement of the 2022 advance and the August 2024 low-week close (LWC). Note that the lower parallel of the 2025 pitchfork and the 2023 trendline converges on this zone over the next week and the focus is on a possible price inflection off confluent support in the days ahead.
Bitcoin Price Chart – BTC/USD Daily 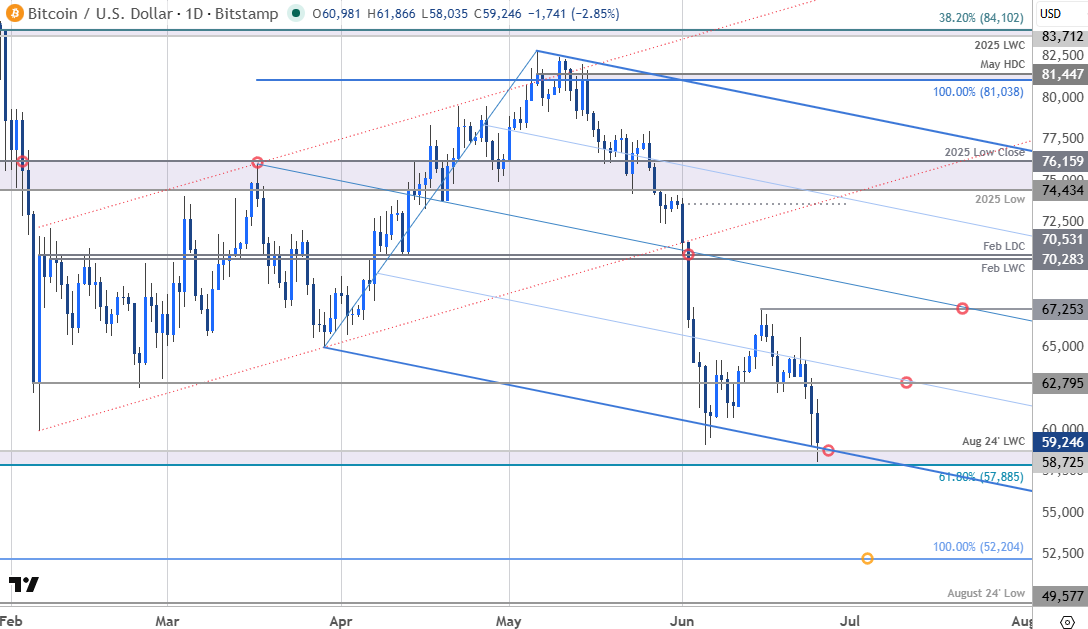
Chart Prepared by Michael Boutros, Sr. Technical Strategist; BTC/USD on TradingView
A closer look at the Bitcoin daily chart shows BTC/USD continuing testing the lower parallel for a second time this month with building RSI divergence highlighting the threat for waning momentum here near-term. Initial resistance is now eyed with the February low close at 62,795 with near-term bearish invalidation now lowered to the June 15 swing high at 67,253.
A break / weekly close below this pivotal support zone would threaten another bout of accelerated losses towards the 100% extension of the 2025 decline at 52,204 and the August 2024 swing low at 49,577. Both levels represent areas of interest for possible downside exhaustion / price inflection IF reached.
Bottom line: Bitcoin is testing confluent support at the lower bounds of the yearly downtrend, and the focus is on reaction off this mark with the immediate short bias is vulnerable while above. From a trading standpoint, rallies would need to be limited to 62,795 IF price is heading lower on this stretch with a close below 57,885 needed to fuel the next major leg of the decline. Keep in mind we are on the lookout for a potential exhaustion low in the weeks ahead and as correction matures. Stay nimble here and watch the weekly closes for guidance.
Active Weekly Technical Charts
- Swiss Franc (USD/CHF)
- Gold (XAU/USD)
- British Pound (GBP/USD)
- Euro (EUR/USD)
- Australian Dollar (AUD/USD)
- Canadian Dollar (USD/CAD)
- US Dollar Index (DXY)
- Japanese Yen (USD/JPY)
--- Written by Michael Boutros, Senior Technical Strategist
Follow Michael on X @MBForex







Web Trader platform
Our sophisticated web-based platform is packed with features.
Open an account today
Experience award-winning platforms with fast and secure execution.
Economic calendar
Related articles

Canadian Dollar Forecast: USD/CAD Weekly Reversal Puts Yearly Uptrend Back in Focus 8 29 2026
USD/CAD has staged its strongest weekly advance since June, shifting the focus to whether a more durable low is finally taking shape.

USD/JPY weekly outlook: Payrolls may challenge the Fed’s hawkish reset
USD/JPY has finally woken from its slumber. Payrolls now loom as the key test of whether the latest hawkish repricing sticks or sinks.


Euro Short-term Outlook: EUR/USD Pullback Nears Pivotal Uptrend Support 8 28 2026
Warsh's comments accelerated the EUR/USD selloff, raising the stakes as buyers look to stabilize the broader recovery.