


British Pound Forecast: GBP/USD Plunge Puts Yearly Range on the Line
Sterling’s failed recovery has GBP/USD closing in on critical trend support, with the next weekly close poised to shape the November outlook.
Written by
Michael Boutros
Sr. Technical Strategist
British Pound Technical Forecast: GBP/USD Weekly Trade Levels
- GBP/USD has reversed sharply from October resistance, surrendering much of its three-week recovery as selling pressure intensifies.
- Sterling is approaching a major support confluence at the lower bounds of the yearly consolidation pattern- inflection risk rises.
- A decisive weekly close below this threshold would threaten a more significant breakdown and threaten the broader 2025 advance.
- Bulls need to reclaim the yearly opening price to strengthen the case for a more meaningful recovery.
- U.K. inflation and retail-sales data, alongside U.S. PPI and retail sales, headline event risk as markets reassess the outlook for Fed and BoE policy.
- Resistance 1.3406/09, 1.3470/74 (key), 1.3558- Support 1.3194-1.3215 (key), 1.3092, 1.2965
The British Pound is back on the defensive after buyers failed to sustain the October advance, leaving GBP/USD at a potentially decisive inflection point heading into mid-November. The broader technical structure has deteriorated, although the latest decline is approaching a well-defined confluence of longer-term support where sellers may encounter renewed opposition. The significance of this threshold is reinforced by the weekly closing-price structure, which has repeatedly marked important turning points throughout the year. With the immediate outlook favoring the bears, the next reaction could determine whether Sterling finds another foothold within the broader consolidation or faces a more substantial correction into year-end. Battle lines drawn on the GBP/USD weekly technical chart.
British Pound Price Chart – GBP/USD Weekly
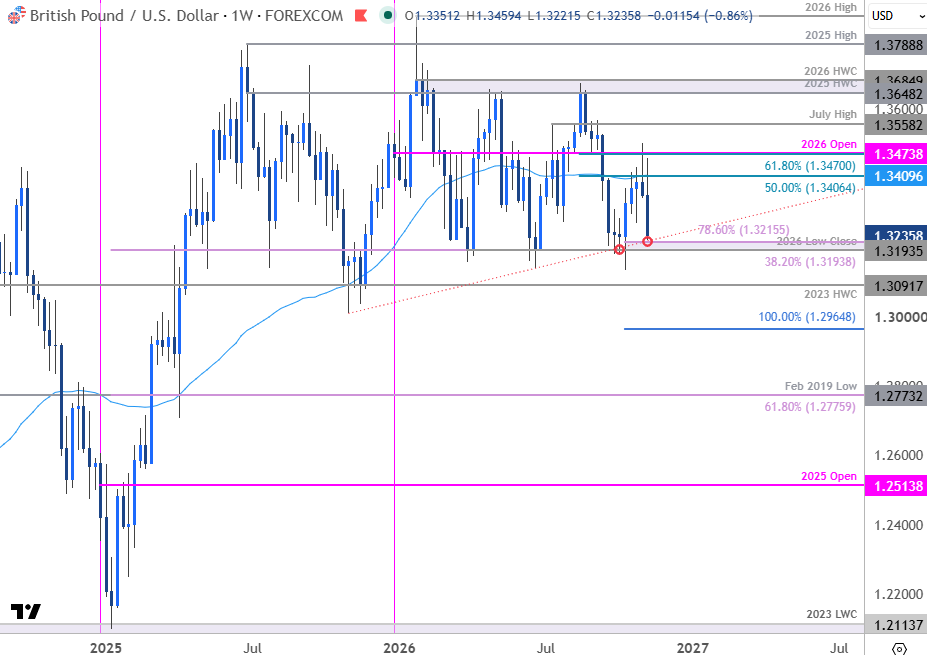
Chart Prepared by Michael Boutros, Sr. Technical Strategist; GBP/USD on TradingView
Technical Outlook: In last month’s British Pound Weekly Forecast we noted that GBP/USD had, “rebounded sharply off critical support at the yearly range lows, and the focus is on this recovery. From a trading standpoint, losses would need to be limited to the monthly open at 1.3265 IF price is heading higher on this stretch with a close above 1.3474 needed to suggest a more significant low is in place and fuel the next major leg of the rally.” A three-week rally extended nearly 2.8% off the yearly low and despite registering an intraday high at 1.3503, the bulls were unable to mark a weekly close above key resistance.
The subsequent reversal has plunged more than 2% with Sterling now approaching confluent support at 1.3194-1.3215. This region is defined by the 2026 low-close, the 38.2% retracement of the 2025 advance, and the 78.6% retracement of the October rally. Note that basic trendline support extending off the 2025 November low now converges on this threshold.
British Pound Price Chart – GBP/USD Weekly (Line Chart)
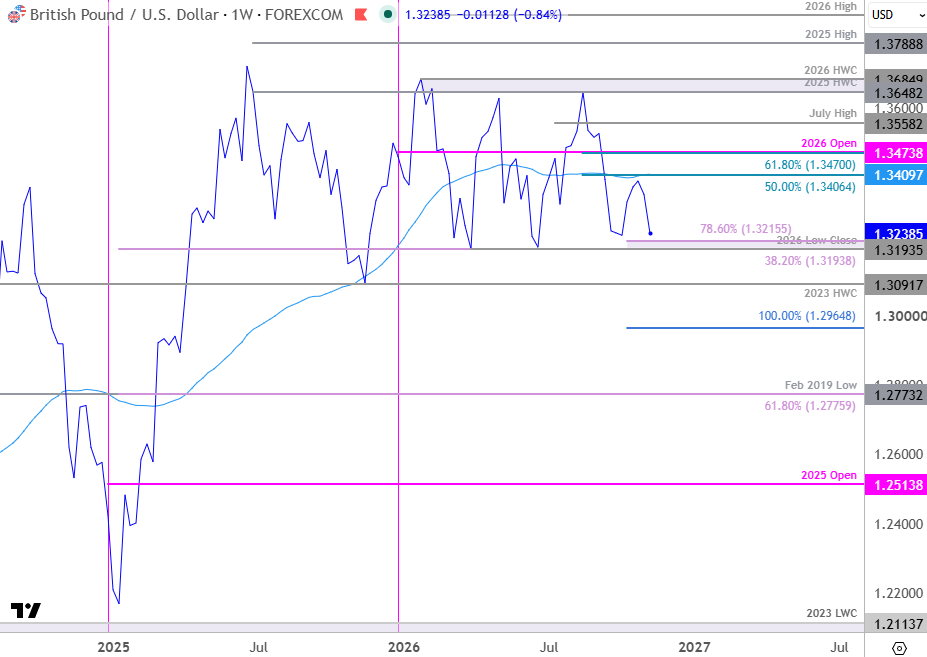
Chart Prepared by Michael Boutros, Sr. Technical Strategist; GBP/USD on TradingView
A simple line chart shows GBP/USD trading within a massive yearly range with the weekly closes highlighting the significance of this critical pivot zone. The immediate focus is on possible inflection off this threshold with a break / weekly close below needed to validate a breakout of the yearly consolidation pattern.
Initial resistance remains at the 50% retracement of the August decline and the 52-week moving average at 1.3406/09 with key resistance steady at the 61.8% retracement and the 2026 yearly open at 1.3470/74. A breach / weekly close above this threshold is needed to suggest the low is in place and a larger recovery is underway. Subsequent resistance is eyed at the July swing high at 1.3558.
A break below key support would threaten another bout of accelerated losses with subsequent support objectives seen at the 2023 high-week close (HWC) at 1.3092 and the 100% extension of the August decline at 1.2965. Look for a larger reaction there IF reached. The next major technical consideration rests with the February 2019 swing low and the 61.8% retracement of the 2025 rally at 1.2773/75.
Bottom line: The October rally failed at critical resistance last week with GBP/USD once again approaching a major support zone at the 2026 close low. Weekly momentum is now approaching the lowest levels of the year and while the medium-term outlook remains weighted to the downside the bears may be vulnerable while above this threshold. From a trading standpoint, rallies would need to be limited to the 1.33-handle IF price is heading lower on this stretch with a close below 1.3194 needed to fuel the next major leg of the decline.
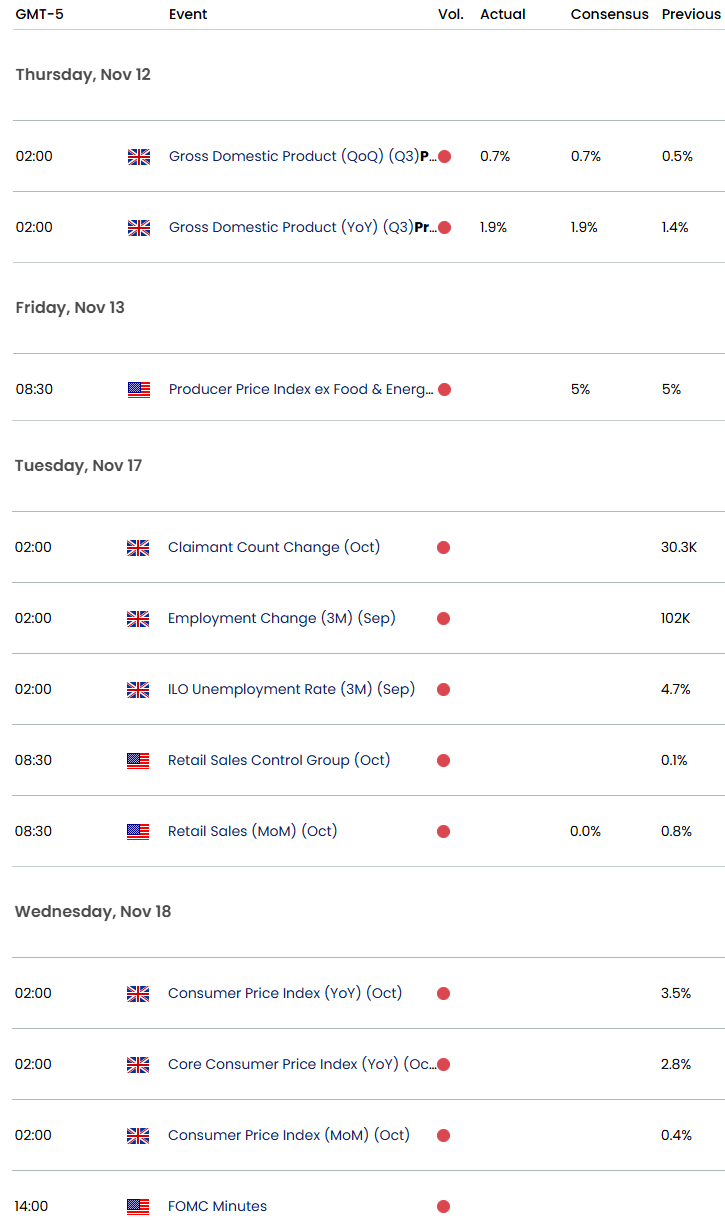
GBP/USD event risk into the weekly close and next week will be driven by the changing balance between U.K. growth and U.S. rate expectations. Today’s U.K. GDP report showed the economy expanded 0.7% in the third quarter, matching expectations, while September GDP rose 0.2%. Attention now shifts to Friday’s U.S. PPI report and next week’s U.K. CPI and retail-sales data, alongside U.S. retail sales and consumer sentiment. With the latest U.S. inflation data reinforcing expectations for further Fed tightening, sterling will need evidence of persistent U.K. price pressure or stronger domestic demand to offset the dollar’s rate advantage. Stay nimble into the releases and watch the weekly closes for guidance. I will publish an updated British Pound Short-term Outlook once we get further clarity on the near-term GBP/USD technical trade levels.
GBP/USD Economic Data Releases
--- Written by Michael Boutros, Senior Technical Strategist
Follow Michael on X @MBForex
Latest market news









Web Trader platform
Our sophisticated web-based platform is packed with features.
Open an account today
Experience award-winning platforms with fast and secure execution.
Economic calendar
Related articles

USD/JPY Weekly Outlook: AI earnings could overshadow the Fed and BoJ
AI sentiment has become a major driver of US Treasury yields and USD/JPY. With Microsoft, Alphabet and Amazon reporting this week, central bank decisions may have competition for traders' attention.


EUR/USD forecast: All eyes on Warsh at Jackson Hole - Forex Friday
For much of this week, the EUR/USD has been edging lower with the US dollar regaining some ground after last week’s sell-off that was triggered, in part, by the bond market worries. Investors have been unwilling to bet further against the US dollar so far this week ahead of Kevin Warsh’s keynote speech at the Jackson Hole summit, due later today.


Bitcoin Forecast: BTC/USD Back to $80K Ahead of Warsh’s Jackson Hole Speech
After surging over $15,000 in the past 10 days alone, there is risk of a near-term pullback if Warsh says anything remotely hawkish at Jackson Hole - what are the levels to watch from here?
