


BTC/USD Outlook: Bitcoin defies macro headwinds as volatility evaporates
Bitcoin has weathered the surge in the US dollar and Treasury yields remarkably well, but realised volatility has fallen towards historical lows. A study of nearly a decade of price history suggests larger swings may be coming.
Written by
David Scutt
Market Analyst
- Bitcoin has weathered dollar strength and rising Treasury yields
- Equity correlations remain positive, supporting Bitcoin's relative resilience
- Realised volatility has fallen towards historically unusual levels
- History favours renewed volatility, but offers little directional guidance
Bitcoin has held up remarkably well despite the surge in the US dollar and Treasury yields seen in September, particularly compared with other non-yielding assets such as gold and silver. Since breaking to levels not seen since January, the price has largely consolidated in a sideways range.
However, realised volatility has declined sharply, and historical studies suggest that quiet periods such as this often precede a renewed pickup in volatility. If this episode is no exception, the question may be less about whether volatility returns and more about which direction Bitcoin takes when it does.
Risk appetite doing the heavy lifting
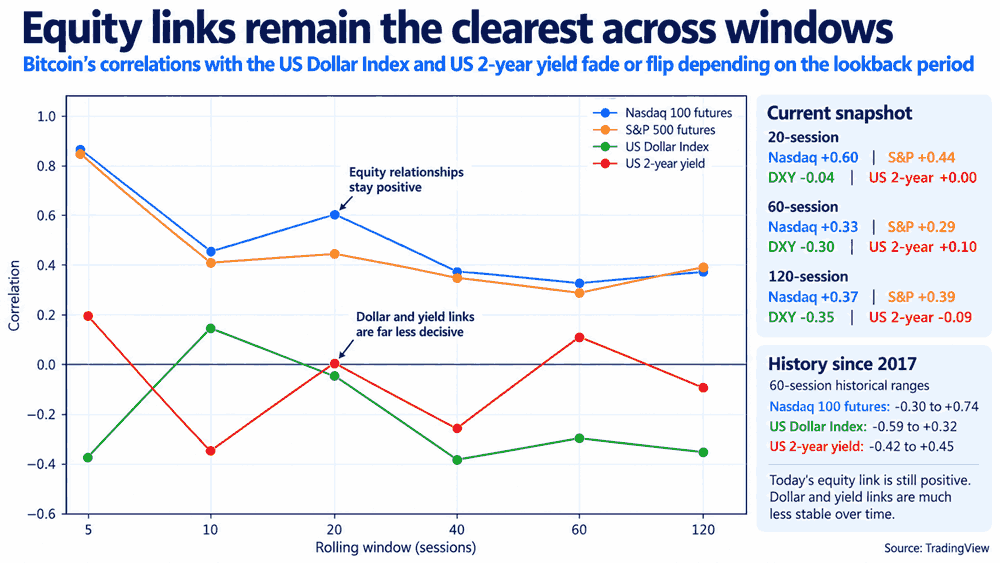
The resilience of BTC/USD's recent performance may be explained by the graphic below, showing its rolling correlations with US equity futures, the US Dollar Index and two-year Treasury yields across multiple timeframes.
Source: TradingView
The consistently positive relationship with equity futures suggests risk appetite, supported heavily by the AI trade, may be doing much of the heavy lifting.
By contrast, Bitcoin has shown virtually no relationship with the dollar or front-end Treasury yields over the past 20 sessions. Even over longer windows of 60 and 120 sessions, the inverse relationship with the dollar is only mild, while there's little meaningful relationship with front-end yields.
Bitcoin realised volatility approaches historical lows
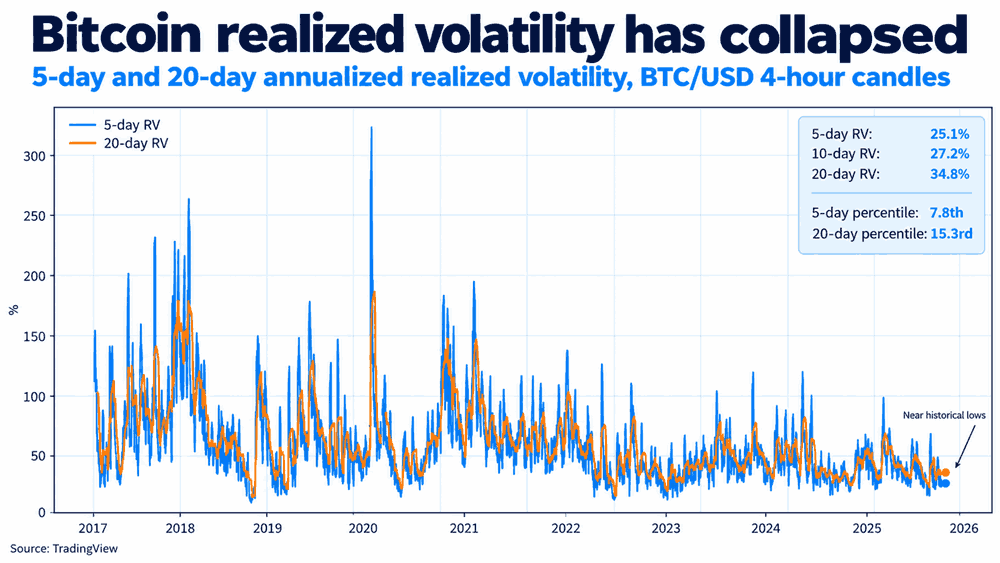
Not only has BTC/USD held up relatively well given the macro environment, its price movements have become increasingly small with realised volatility falling sharply across multiple timeframes.
Annualised five-day realised volatility, which measures the variability of recent price returns, has declined from a recent peak of 48.3% to just 25.1%, placing it in the bottom 8% of observations since 2017. The 10-day measure is also subdued at 27.2%, sitting in the bottom 6% of its historical distribution.
Source: TradingView
History suggests Bitcoin's quiet periods rarely last
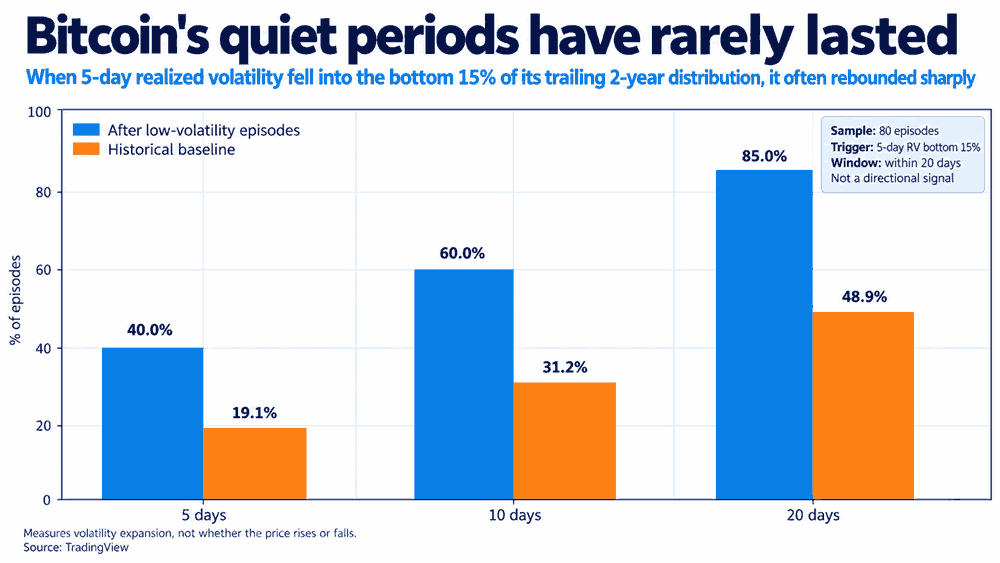
Looking back nearly a decade, there were 80 occasions identified when five-day realised volatility fell into the bottom 15% of its preceding two-year distribution, as it has now.
In 40% of those episodes, five-day realised volatility increased by at least 50% within the following five days. That rose to 60% within 10 days and 85% within 20 days, compared with approximately 49% across the broader historical sample over the latter period.
Source: TradingView
While it makes intuitive sense that unusually low-volatility regimes won't persist indefinitely, historical patterns suggest BTC/USD could experience larger price swings over the coming month.
What makes the timing more noteworthy than usual is the proximity of the US midterm elections on November 3. US President Donald Trump has been a vocal advocate for crypto throughout his second term so far, and uncertainty surrounding the election outcome and its potential implications for future legislation may fuel market volatility.
BTC/USD technical analysis
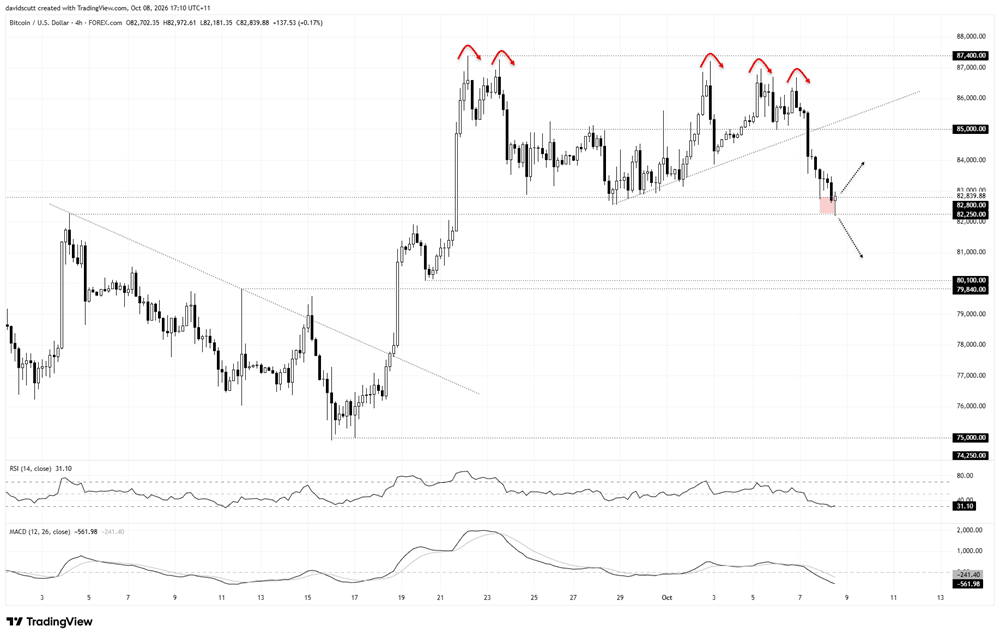
Looking at the four-hour chart below, BTC/USD has spent much of the period following September's bullish breakout trading sideways between $87,400 on the topside and $82,800 below. The lower end of the range has been tested more frequently, including several unsuccessful attempts to break beneath it in late September.
However, beneath the sideways price action, there have been signs of growing selling pressure. Since setting its initial high on September 22, subsequent attempts to push above $87,000 have stalled at progressively lower levels, suggesting sellers have increasingly used rallies to establish positions.
That deterioration preceded yesterday's breakdown through the intersection of the minor uptrend running from the late-September low and horizontal support at $85,000, a level the price has done considerable work either side of over the past month.
The break triggered a pronounced pullback, with a succession of bearish four-hour candles taking BTC/USD to its lowest level since September 21.
However, it's too early to assume we'll see a more pronounced unwind. Today's selling stalled around $82,250, the high set on September 4, which marks the lower boundary of a support zone extending up to $82,800. With the price now trading within that zone, the reaction here will be important in determining near-term directional opportunities.
Momentum indicators favour bears, with RSI (14) sitting at 28 in oversold territory, while MACD has crossed below its signal line and moved further into negative territory.
Source: TradingView
Given the deterioration in price action and message from the oscillators, selling into strength or on confirmed downside breaks is preferred.
A sustained break beneath $82,250, preferably followed by a backtest and rejection of the level, could provide an opportunity to initiate shorts with a tight stop above either $82,250 or $82,800 for protection.
The initial target would be the next support zone between $80,100, the low set on September 20, and $79,840, the high from September 11. A break beneath that area could see the price extend its decline towards $75,000, with $77,000 a level of note along the way.
However, while the price action and momentum indicators currently favour the downside, there's no guarantee a bearish breakdown will eventuate.
Should BTC/USD rebound and reclaim $82,800, longs could also be considered with a tight stop beneath that level or $82,250 for protection, targeting an initial recovery towards $85,000. A break above that level could then open the door to a retest of the resistance zone extending from just beneath $87,000 to $87,400.
Latest market news










Web Trader platform
Our sophisticated web-based platform is packed with features.
Open an account today
Experience award-winning platforms with fast and secure execution.
Economic calendar
Related articles

Gold and S&P 500 analysis: What now after Warsh’s hawkish speech?
The dollar surged across the board after the Fed Chair Kevin Warsh surprised with a hawkish-leaning speech at the Jackson Hole summit. All the bearish dollar bets that had been accumulated since last Friday on the back of data weakness and bond market troubles had to be squared and that triggered a short squeeze rally for the dollar. Gold and silver dropped, as a result, as too did bitcoin, while US indices were giving back earlier gains.


EUR/USD forecast: All eyes on Warsh at Jackson Hole - Forex Friday
For much of this week, the EUR/USD has been edging lower with the US dollar regaining some ground after last week’s sell-off that was triggered, in part, by the bond market worries. Investors have been unwilling to bet further against the US dollar so far this week ahead of Kevin Warsh’s keynote speech at the Jackson Hole summit, due later today.

Bitcoin Forecast: BTC/USD Back to $80K Ahead of Warsh’s Jackson Hole Speech
After surging over $15,000 in the past 10 days alone, there is risk of a near-term pullback if Warsh says anything remotely hawkish at Jackson Hole - what are the levels to watch from here?
