


Canadian Dollar Forecast: The USD/CAD 1.4000 Test
USD/CAD threatened a breakout after the last Fed meeting but ultimately failed to leave the 1.4200 level behind. Since then, 1.4000 has come in as key support but can bulls maintain the move through this FOMC announcement?
Written by
James Stanley
Sr. Strategist
Canadian Dollar Talking Points:
- USD/CAD rallied as USD strength showed after the June FOMC rate decision.
- The pair then showed three weeks of stall at the 1.4200 level, with the following pullback then finding two weeks of support at 1.4000, leading into this week.
It’s been a quieter year so far in 2026 for USD/CAD from what showed up last year. In 2025 the pair began with a tumultuous rally that quickly reversed, pushed along by the tariff saga that produced both a multi-decade high and a dizzying sell-off. But, over the past year, the pair has actually been somewhat calm with a few different revolutions inside of an approximate 700 pip range.
That range did threaten to give way, however, as USD-strength took over after the June FOMC meeting, helping USD/CAD to get back above the vaulted 1.4000 level on its way to a test of 1.4200.
That test of 1.4200 ultimately failed, with three weeks of resistance showing around that price, and the corresponding pullback has, so far, held support at the same spot of 1.4000.
USD/CAD Weekly Price Chart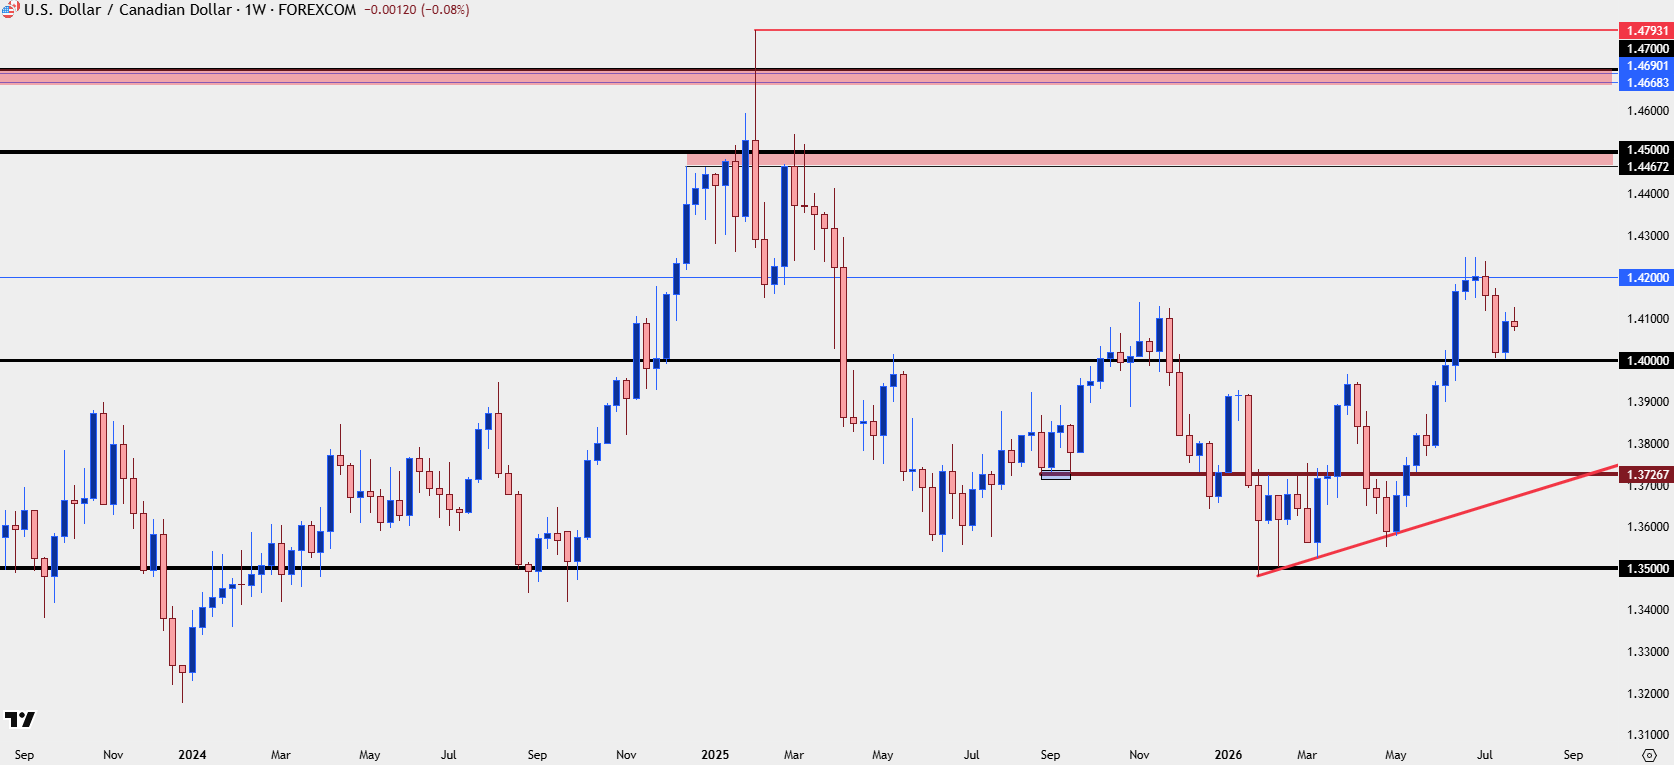
Chart prepared by James Stanley; data derived from Tradingview
USD/CAD Bounce is Fading
Last week was when bulls started to re-appear and this happened after four days of grind around the big figure, and the price action at the time is illuminating as you can see the underside wicks showing buyers coming in to the equation. First, they showed up 25 pips above the big figure, and then ten pips and six pips the following two days. But it’s the big blue candle, taking the appearance of a bullish engulf on July 20th, where bulls started to take back over.
That run led into this week’s open but so far, we’ve seen buyers pulling back on the throttle – so this can be argued in either direction. This can be seen as sellers defending a lower-high, with resistance at prior support around the 1.4150 area. That can keep the door open for another push down towards 1.4000. Or, alternatively, this can be argued as a pause in a bullish continuation move at which point higher-low support should show above the 1.4000 test or, ideally, above the 1.4058 level that showed as a higher-low before the 1.4150 test.
USD/CAD Daily Chart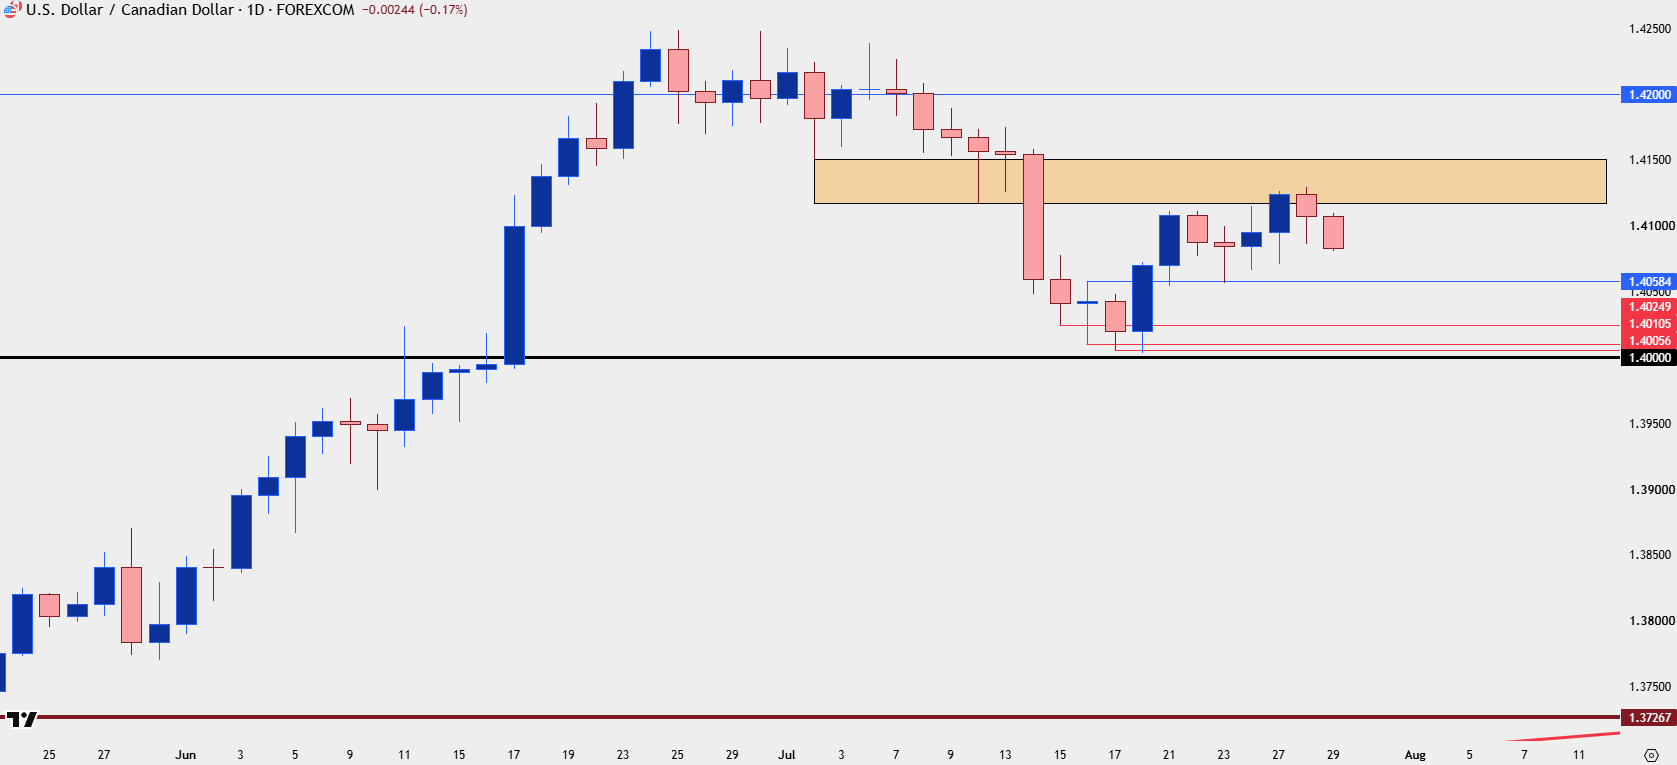
Chart prepared by James Stanley; data derived from Tradingview
--- written by James Stanley, Senior Market Analyst, Global Macro
Related tags:








Web Trader platform
Our sophisticated web-based platform is packed with features.
Open an account today
Experience award-winning platforms with fast and secure execution.
Economic calendar
Related articles

Euro Short-term Outlook: EUR/USD Pullback Nears Pivotal Uptrend Support 8 28 2026
Warsh's comments accelerated the EUR/USD selloff, raising the stakes as buyers look to stabilize the broader recovery.

EUR/USD forecast: All eyes on Warsh at Jackson Hole - Forex Friday
For much of this week, the EUR/USD has been edging lower with the US dollar regaining some ground after last week’s sell-off that was triggered, in part, by the bond market worries. Investors have been unwilling to bet further against the US dollar so far this week ahead of Kevin Warsh’s keynote speech at the Jackson Hole summit, due later today.


AUD/CAD breakout puts the Bradman barrier in sight
A bullish breakout has pushed AUD/CAD to its highest level since early 2021. Whether it can clear 0.9994 may determine if the move extends well above parity.
