


Canadian Dollar Forecast: USD/CAD Tests Breakout—False Break Risk Looms 5 18 2026
USD/CAD is trying to hold above a key breakout zone, and a reaction off this region may determine the next phase of trend. Battle lines drawn.
Written by
Michael Boutros
Sr. Technical Strategist
Canadian Dollar Technical Forecast: USD/CAD Weekly Trade Levels
- USD/CAD is attempting to hold above a key breakout zone after rebounding from April low.
- Price remains trapped near a major pivot as momentum struggles to confirm the advance.
- A move back below former resistance would threaten a false-break scenario and renewed downside.
- A sustained push higher would support a broader recovery toward major resistance levels.
- Resistance 1.3788-1.3808 (key), ~1.39, 1.3944 – Support 1.3725/33, 1.3617 (key), 1.3563
USD/CAD is attempting to stabilize above a major pivot zone after rebounding from multi-week lows, with price action now testing whether the breakout can hold into the weekly close. While the move has improved the near-term technical outlook, momentum remains unconvincing, raising the risk of a false break scenario. The focus now shifts to whether buyers can sustain control above support or if the broader downtrend begins to reassert itself. Battle lines drawn on the USD/CAD weekly technical chart.
Review my latest Weekly Strategy Webinar for an in-depth breakdown of this Loonie setup and more. Join live on Monday’s at 8:30am EST.
Canadian Dollar Price Chart – USD/CAD Weekly
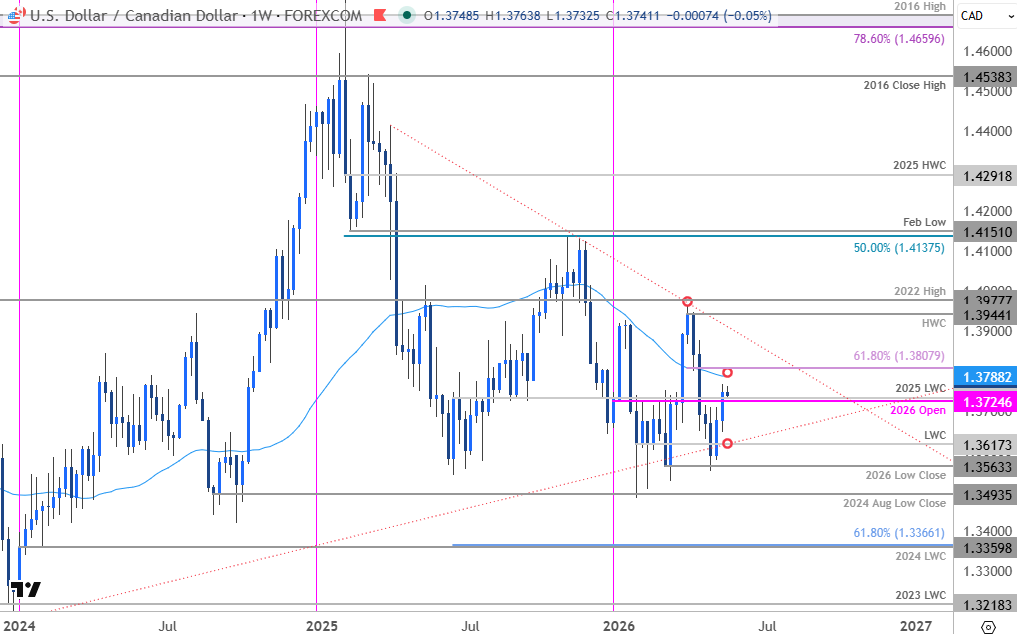
Chart Prepared by Michael Boutros, Sr. Technical Strategist; USD/CAD on TradingView
Technical Outlook: In last month’s Canadian Dollar Technical Forecast we noted that USD/CAD was, “testing major support here on the back of a three-week selloff from the yearly high- risk for price inflection ahead. From a trading standpoint, losses would need to be limited to this week’s low IF price is heading higher on this stretch with a close above 1.3733 needed to suggest a more significant medium-term low is in place.” USD/CAD dropped into the yearly low-close that week before rebounding into the May open with price marking a weekly close above a key pivot zone last week. Is a more significant low in place?
The pivot zone in focus is 1.3725/33- a region defined by the objective yearly open, the February high, and the 2025 low-week close (LWC). While a close above this zone last week dose open the door to further gains, weekly momentum remains sub-fifty and the bulls have not yet offered a convincing push. That said, the weekly opening-range is taking shape just above this mark and a breakout in the days ahead may offer guidance here.
Initial weekly resistance is eyed at the 52-week moving average and the 61.8% retracement of the March decline at 1.3788-1.3808. A topside breach / weekly close above this threshold would be needed to fuel the next major leg of the advance towards the 2025 trendline (currently near ~1.39) backed by the yearly high-week close (HWC) at 1.3944 and the 2022 swing high at 1.3978. Both levels of interest for possible topside exhaustion / price inflection- look for a larger reaction there IF reached.
A pivot back below the yearly open would threaten a false break scenario with weekly support targets unchanged at the yearly low-week close (LWC) at 1.3617 and the 2026 low close at 1.3563. Losses below this threshold would threaten a retest of the yearly lows with subsequent support seen at the 2024 August low close at 1.3494 and 1.3360/66.
Bottom line: USD/CAD is attempting to validate a break above a key pivot zone, and the focus is on the weekly close with respect to 1.3725/33. From a trading standpoint, losses would need to be limited to 1.3617 IF price is heading higher on this stretch with a close above 1.3808 ultimately needed to fuel the next major leg of the advance.
The economic calendar is rather light this week with Canada CPI tomorrow headlining the docket. The Iranian war negotiations will be central focus again this week. The prolonged blockade of the Hormuz Strait has continued to squeeze the energy sector with little progress made on a resolution. Markets are beginning to price in a protracted conflict with Fed Fund Futures now putting a December rate hike at 50/50. This shift in interest rate expectations has favored the US Dollar and persistent high energy prices may pressure the central bank to address rising inflation this year more aggressively. Keep an eye on the war headlines and watch the weekly close here for guidance. Review my latest Canadian Dollar Short-term Outlook for a closer look at the near-term USD/CAD technical trade levels.
US / Canada Economic Data Release
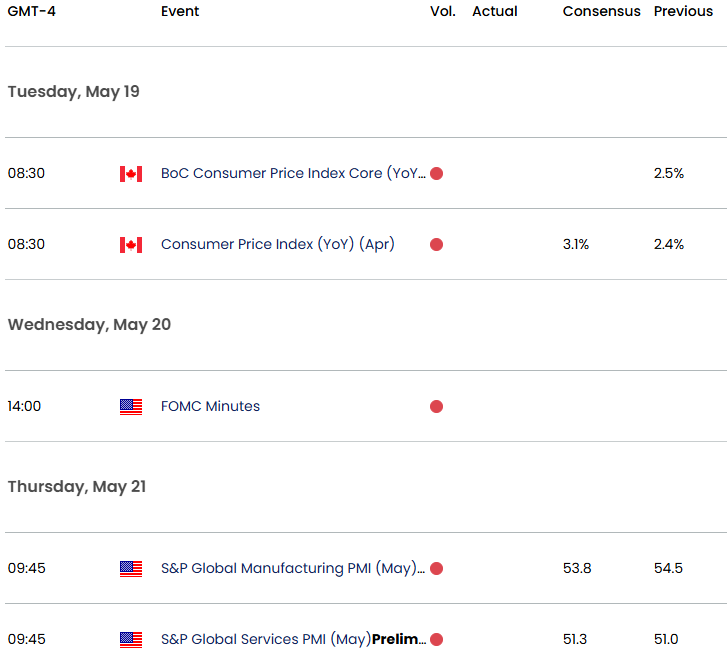
Economic Calendar - latest economic developments and upcoming event risk.
Active Weekly Technical Charts
- Euro (EUR/USD)
- US Dollar Index (DXY)
- Gold (XAU/USD)
- Japanese Yen (USD/JPY)
- Australian Dollar (AUD/USD)
- Swiss Franc (USD/CHF)
- Bitcoin (BTC/USD)
- British Pound (GBP/USD)
- S&P 500, Nasdaq, Dow
--- Written by Michael Boutros, Senior Technical Strategist
Follow Michael on X @MBForex







Web Trader platform
Our sophisticated web-based platform is packed with features.
Open an account today
Experience award-winning platforms with fast and secure execution.
Economic calendar
Related articles

Euro Short-term Outlook: EUR/USD Pullback Nears Pivotal Uptrend Support 8 28 2026
Warsh's comments accelerated the EUR/USD selloff, raising the stakes as buyers look to stabilize the broader recovery.

EUR/USD forecast: All eyes on Warsh at Jackson Hole - Forex Friday
For much of this week, the EUR/USD has been edging lower with the US dollar regaining some ground after last week’s sell-off that was triggered, in part, by the bond market worries. Investors have been unwilling to bet further against the US dollar so far this week ahead of Kevin Warsh’s keynote speech at the Jackson Hole summit, due later today.


AUD/CAD breakout puts the Bradman barrier in sight
A bullish breakout has pushed AUD/CAD to its highest level since early 2021. Whether it can clear 0.9994 may determine if the move extends well above parity.
