


Crude Oil & DXY Outlook: Bullish Setups Hold as US-Iran Tensions Persist
Crude oil and DXY bullish setups remain intact as Middle East tensions persist, Fed rate hike expectations reclaim the 50% threshold, and US Treasury yields return toward their 2026 highs.
Written by
Razan Hilal
Market Analyst
Crude oil and DXY bullish setups remain intact as US-Iran negotiations hit another impasse, Fed rate hike expectations reclaim the 50% threshold, and US Treasury yields return toward their 2026 highs.
US-Iran talks remain indirect through Omani mediation, with a long-term resolution increasingly difficult to reach as disagreements over the Strait of Hormuz persist. Markets are consequently reassessing how quickly Gulf oil exports can normalize, keeping a geopolitical risk premium embedded in crude prices. That backdrop is further complicated by US Strategic Petroleum Reserve inventories falling below 300 million barrels for the first time since 1983, leaving reserves at their lowest level in more than four decades.
The H2 2026 outlook therefore remains at a critical juncture despite the market's eagerness to price in geopolitical relief. Crude oil remains at the center of this cross-asset chain, directly reflecting escalation and de-escalation expectations before feeding through to inflation and Fed policy expectations, Treasury yields, US Dollar strength, and broader market risk sentiment.
Rate Hike Odds Resurface Near 50%
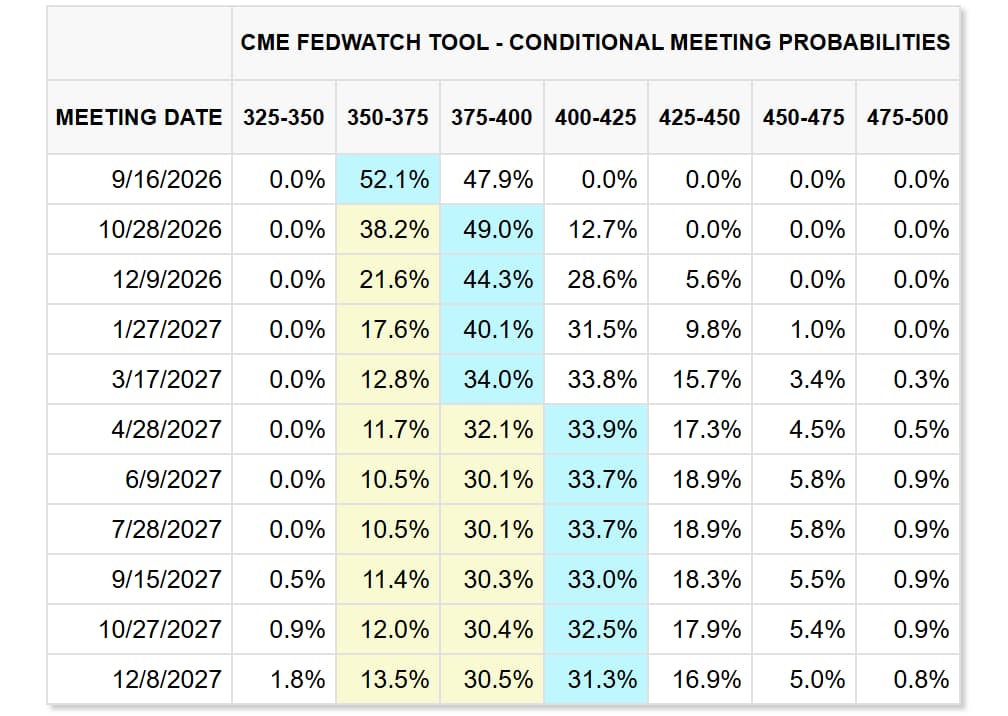
Source: CME FedWatch Tool
Rate hike expectations for both the September and October Fed meetings have fluctuated around the 50% threshold, leaving markets finely balanced ahead of tomorrow's US CPI release.
The inflation data could provide a more definitive catalyst for rate expectations following nearly six months of supply-chain disruptions and renewed pressure on strategic reserves.
A stronger-than-expected CPI print could reinforce expectations for tighter monetary policy, supporting Treasury yields and the US Dollar. Conversely, softer inflation data could ease those expectations and provide some relief to risk assets.
US Treasury Yields: 5-Year, 10-Year and 30-Year – Log Scale
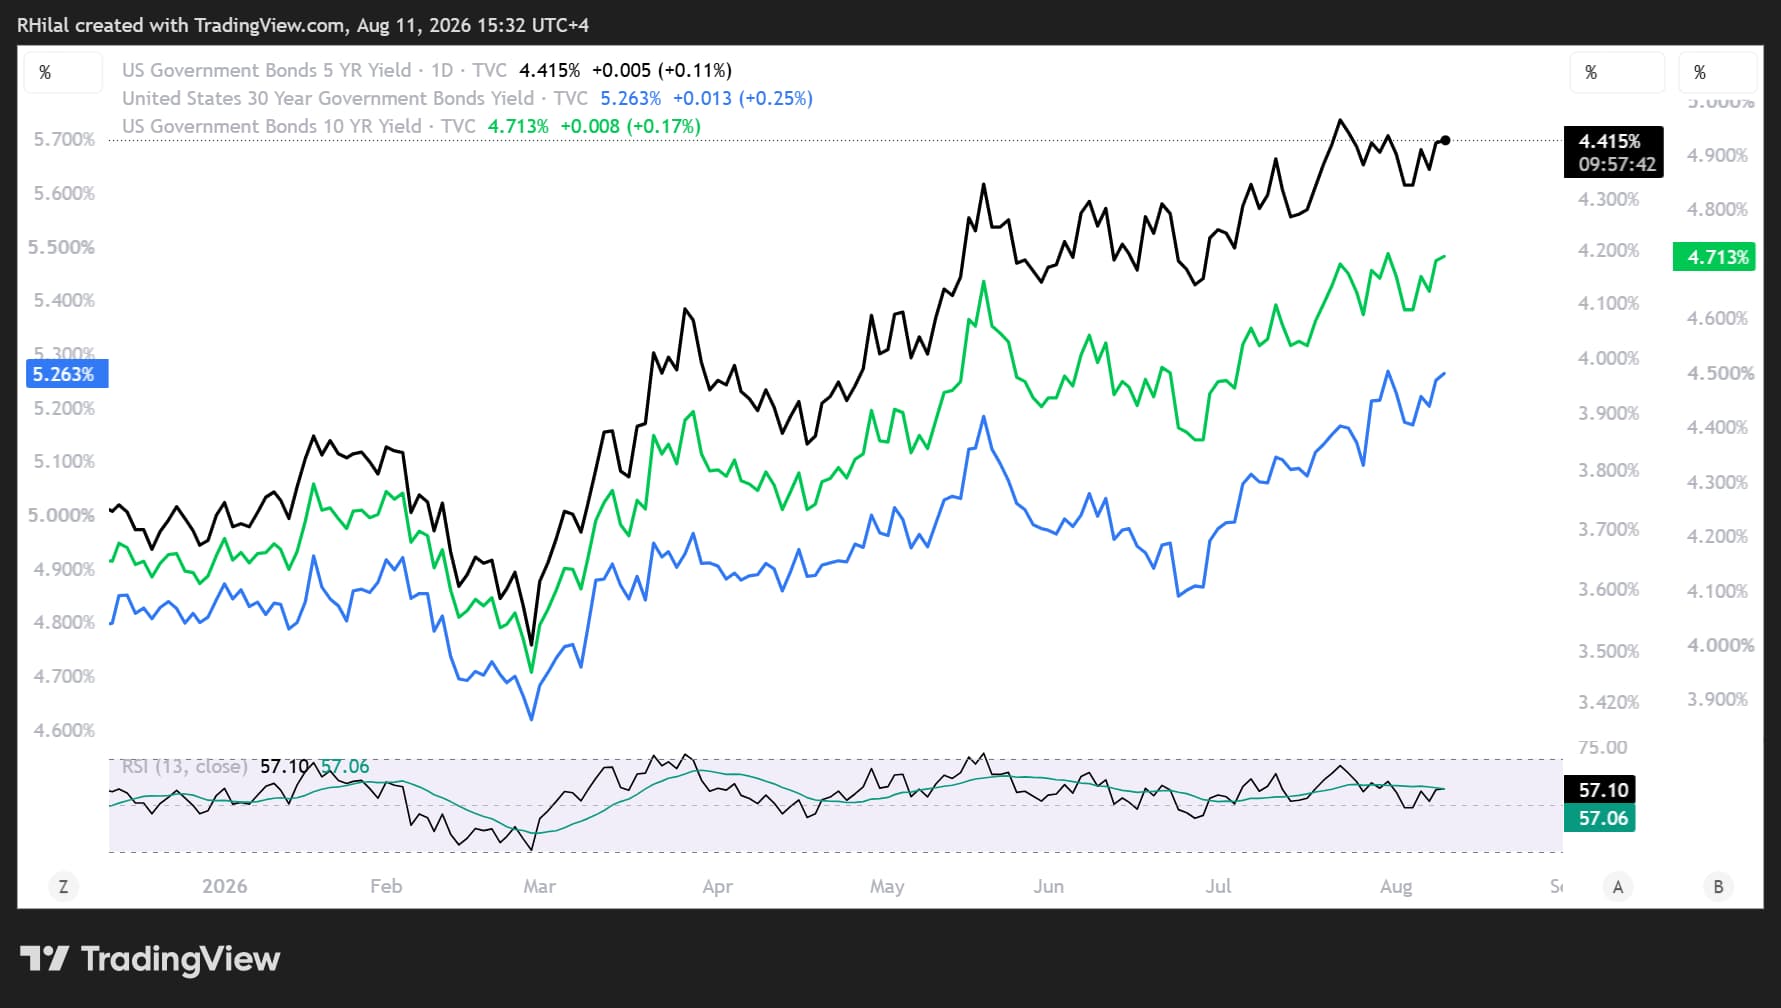
Source: TradingView
Long-term Treasury yields are once again approaching their 2026 highs, with the 10-year yield above 4.7% and the 30-year above 5.2%, both maintaining an upside bias.
That move provides another signal of caution for broader risk appetite.
At the same time, the Dow is testing the upper boundary of a four-year channel, while Bitcoin has struggled to break decisively beyond its June-August consolidation. Together, these developments leave correlated markets at an important technical juncture: either a broader pullback begins to develop, or markets confirm another longer-term breakout phase towards H2 2026.
The timing of either scenario is likely to remain closely correlated across assets, with crude oil and the US Dollar among the key charts to watch for confirmation.
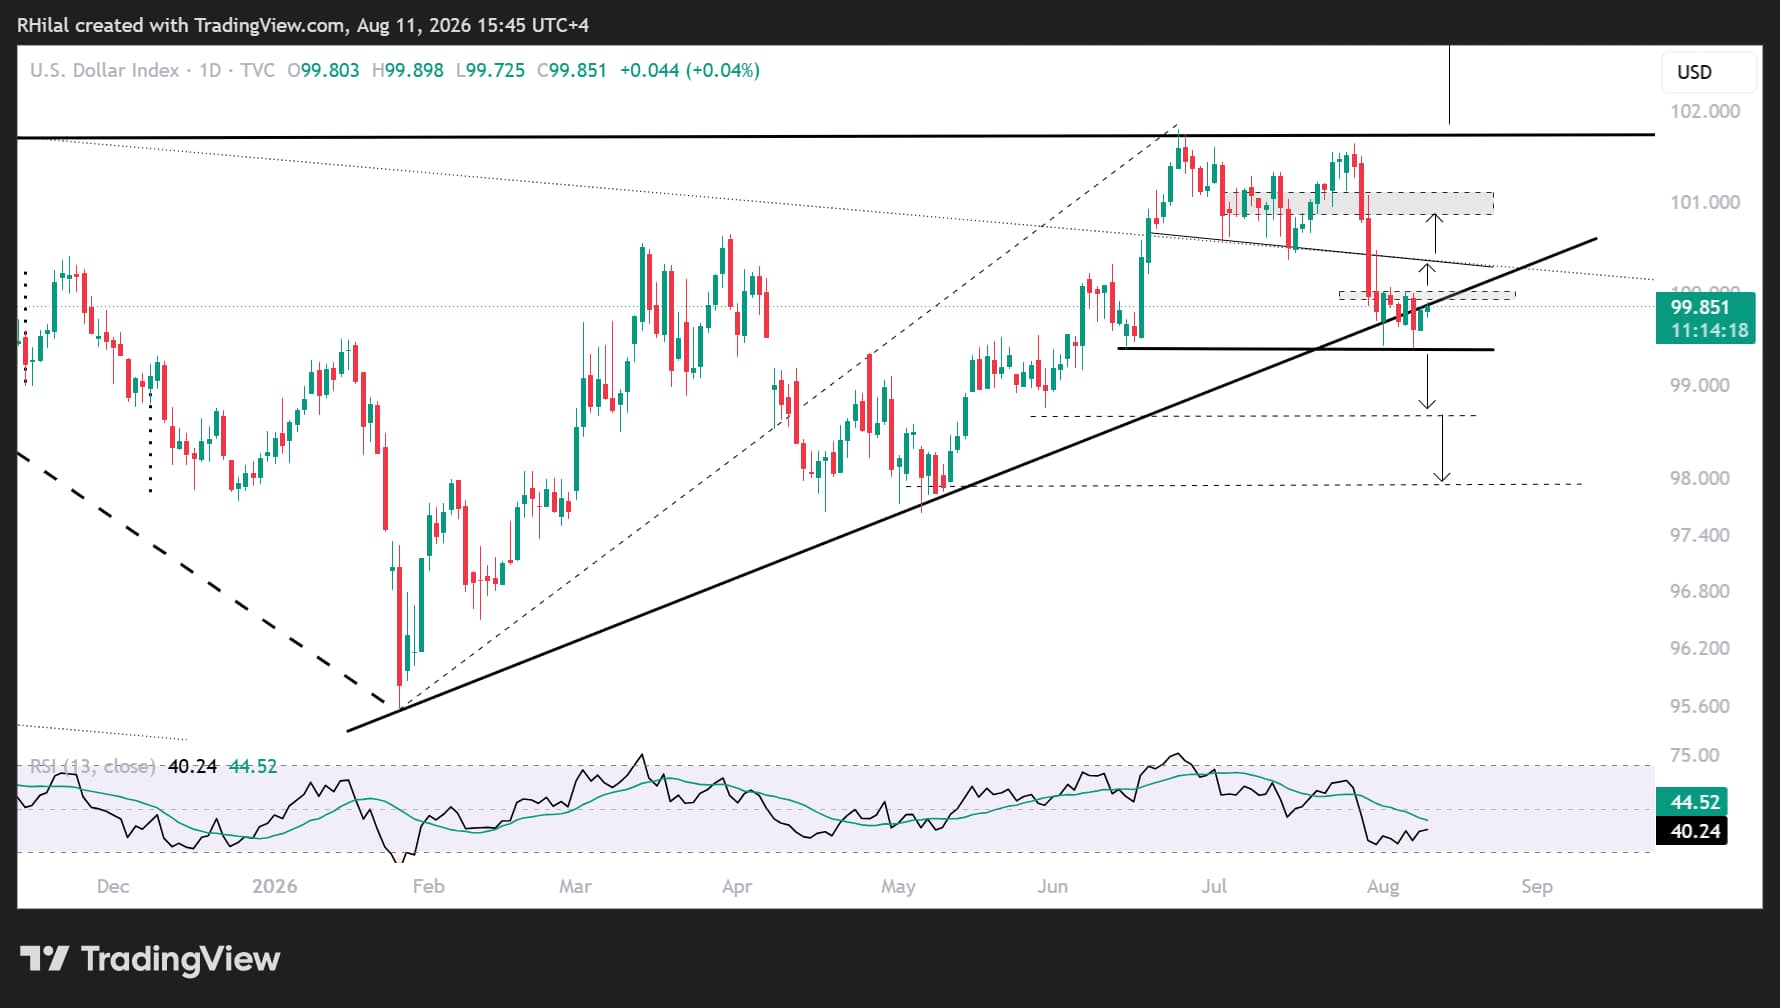
DXY Outlook: Daily Time Frame – Log Scale
Source: TradingView
The recent pullback in the US Dollar Index occurred just below the critical 101.80-102.00 resistance zone, which remains the key area required to confirm another bullish breakout.
Despite the decline, DXY price action continues to respect several important technical signals:
- The ascending trendline connecting the higher lows established throughout 2026, reinforcing the broader bullish structure.
- The 99.30 level, representing the 38.2% Fibonacci retracement of the 2026 advance.
- Oversold daily momentum conditions last seen in January 2026.
As long as the index remains above the 99.30-100.30 support zone, the broader 2026 bullish outlook remains intact.
A breakdown below 99.30 could shift the technical narrative and increase bearish pressure toward the 98.60-98.00 region, which includes the 61.8% Fibonacci retracement.
The daily chart therefore continues to suggest that the recent DXY weakness represents a correction within the prevailing uptrend rather than the beginning of a broader reversal—a view that remains consistent with the monthly technical structure.
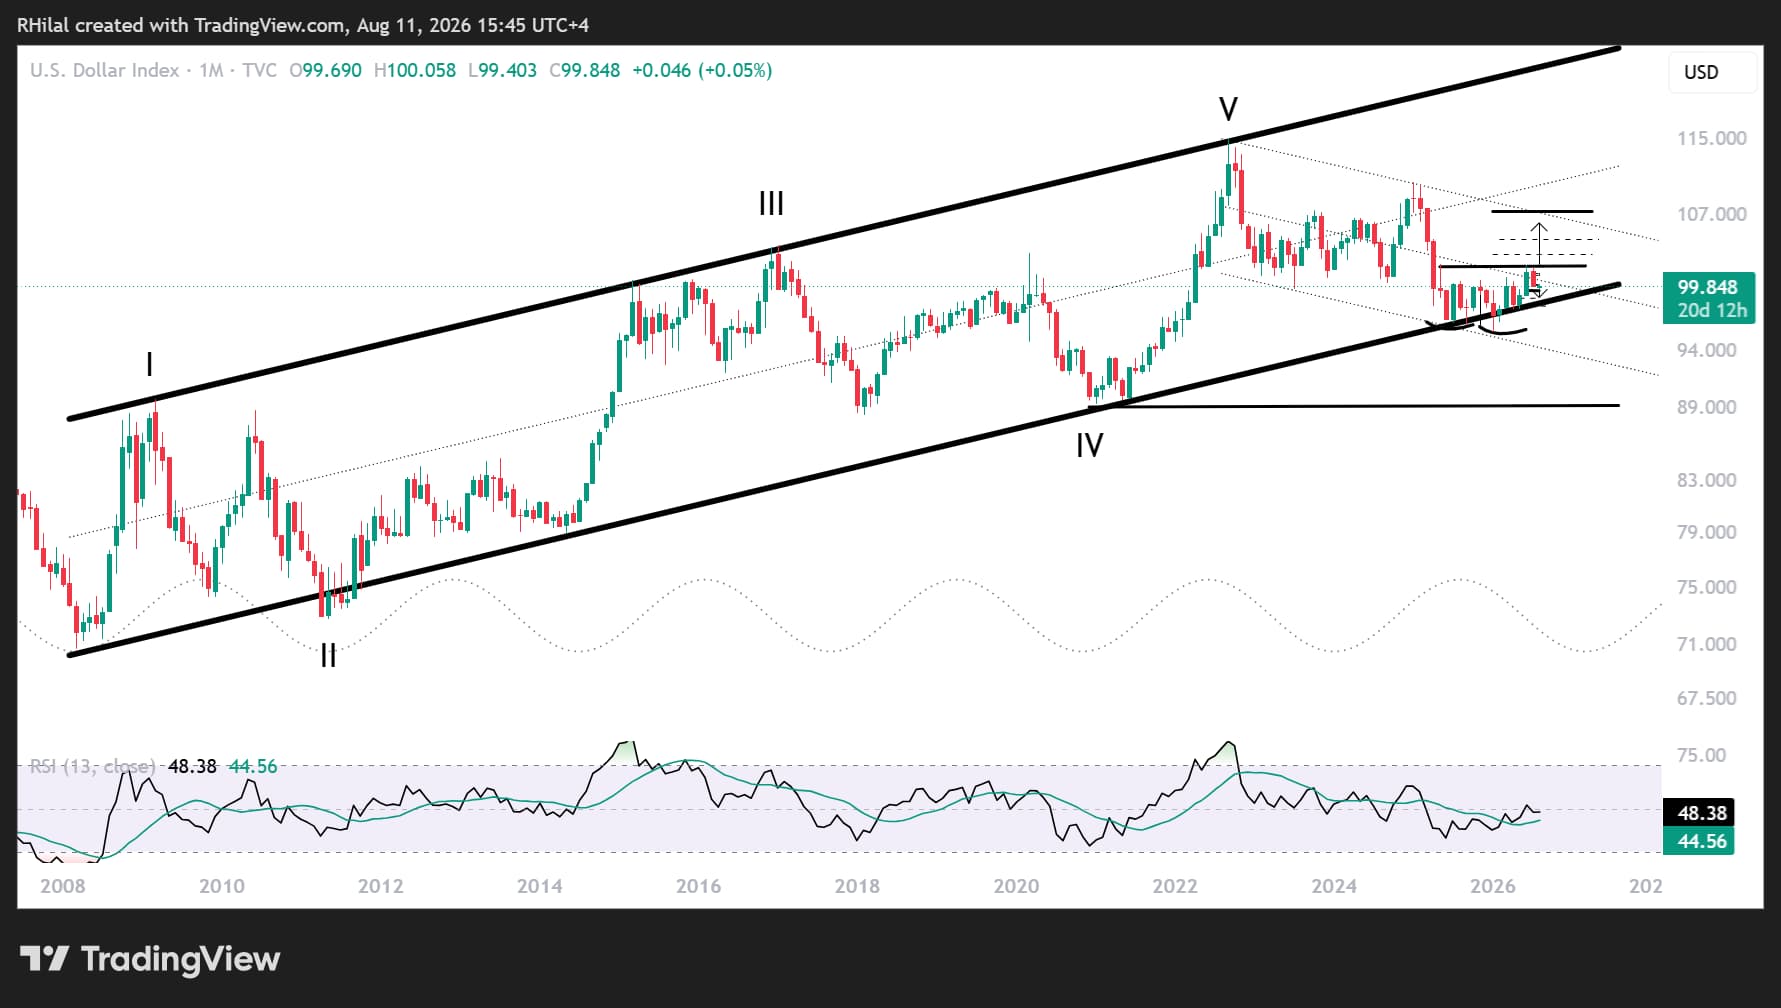
DXY Outlook: Monthly Time Frame – Log Scale
Source: TradingView
The monthly DXY chart continues to reinforce the US Dollar Index's broader bullish structure through several important technical developments:
- An ascending channel dating back to 2008 continues to support the Dollar Index's long-term uptrend. Its lower boundary, near the 95-97 zone, remains the next major support area should DXY close below 99.30 and invalidate the current 2026 bullish structure. Such a move could either trigger another long-term rebound or signal the beginning of a broader structural drawdown.
- DXY is currently in pullback mode after testing a major technical confluence. This area includes:
- The neckline of a potential double-bottom formation, positioned between the long-term ascending channel from 2008 and the descending channel in place since 2022.
- The midpoint of the 2022-2026 descending channel.
- A multi-year support and resistance zone that has repeatedly influenced price action since 2023.
A monthly close above 102.00 would strengthen the bullish DXY outlook and expose the next resistance levels at 102.80 and 104.50, followed by 107.00.
The 107.00 region is particularly significant as it aligns with the upper boundary of the descending channel in place since 2022.
WTI Crude Oil Outlook: $72 Support Keeps Bullish Structure Intact
Source: Trading view
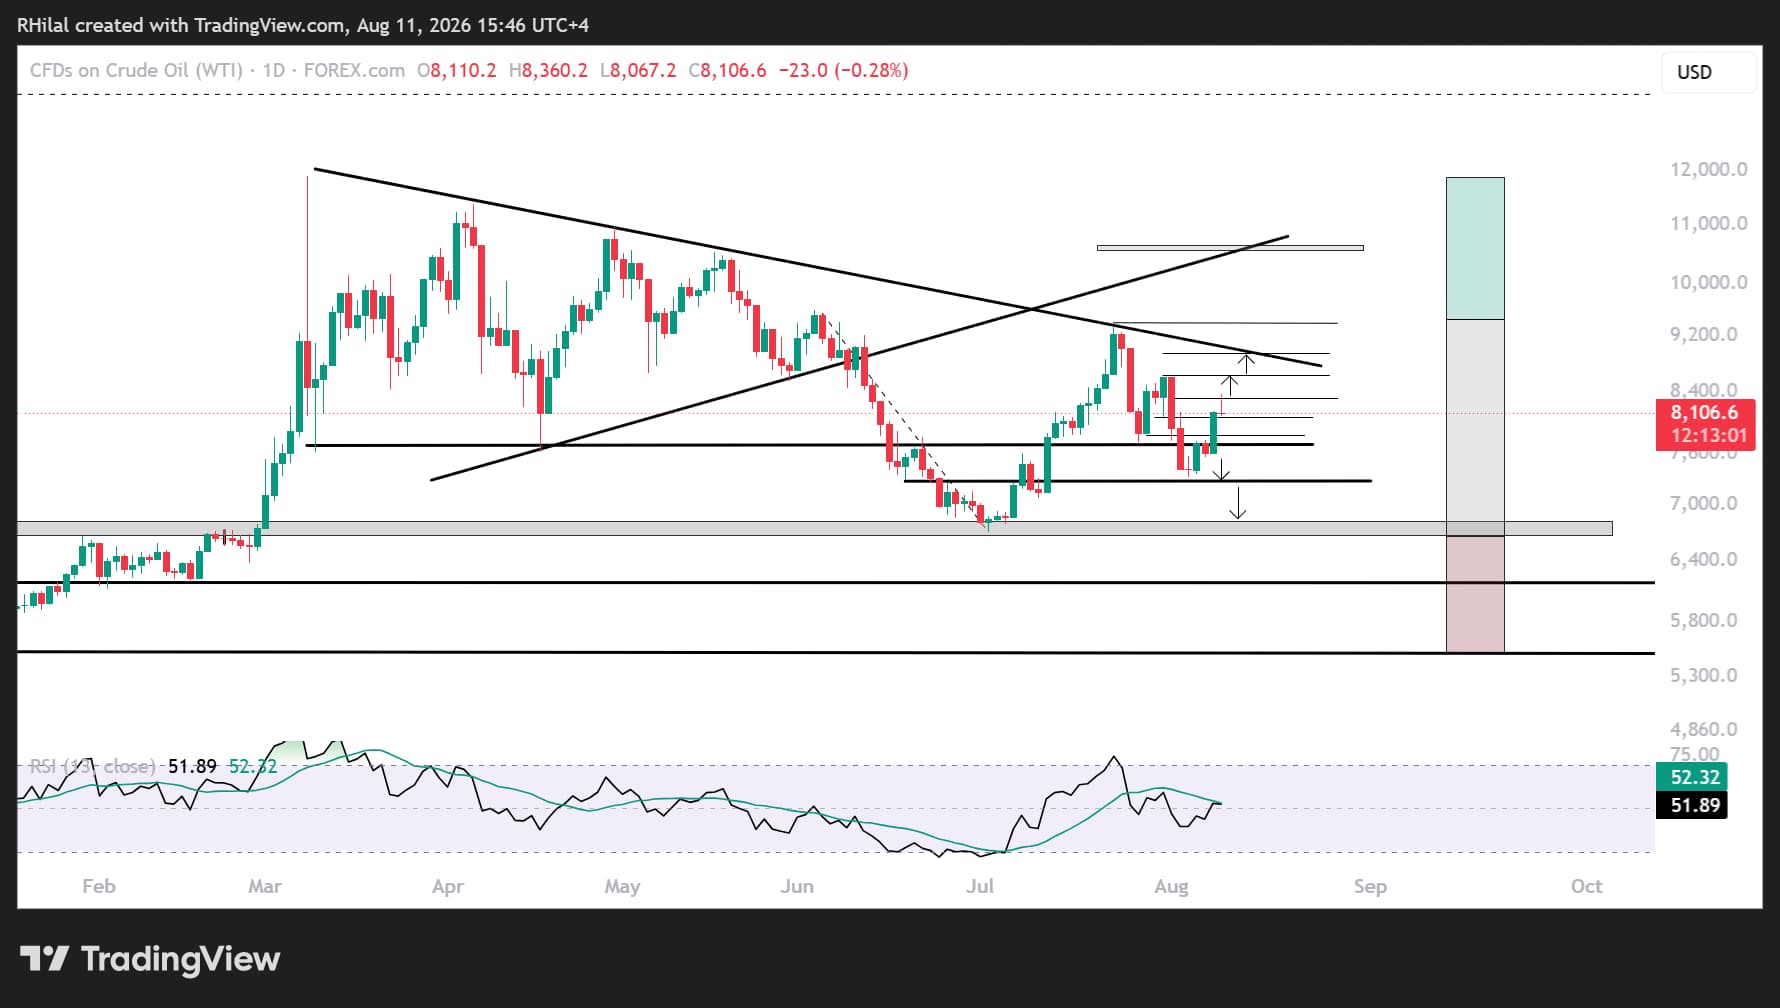
WTI crude oil's latest pullback found support around $72, corresponding to the 78.6% Fibonacci retracement of July's advance. Persistent US-Iran tensions have helped stabilize prices above that level.
Price action continues to hold above the $70-$72 zone, maintaining the geopolitical risk premium and preserving the broader bullish technical structure.
A sustained move above $83.30—38.2% Fibonacci extension of the July-August cycle targets:
- $86.50 – 50% Fibonacci extension
- $89.60 – 61.8% Fibonacci extension and a major area of potential pullback risk
The $89.60 region also realigns with the multi-month trendline extending from the lower boundary of the March-June consolidation, which eventually gave way to July's selloff from the $93-$77 region.
A move toward these higher targets would likely coincide with persistent tensions around the Strait of Hormuz and continued disruption risks involving crude oil infrastructure and refineries.
More importantly, a sustained hold above the $86.50-$89.60 region could signal that markets are beginning to price another phase of geopolitical escalation, potentially increasing inflationary pressure and drawdown risks across broader financial markets.
WTI Bearish Scenario
Should WTI crude oil fall back below $72, attention would immediately shift toward the $68-$66.50 support zone.
This area continues to define the broader escalation-versus-de-escalation narrative for 2026, having repeatedly acted as both support and resistance since 2019.
A weekly close below $66.50 would expose the 2026 lows near $55 and could indicate that markets are beginning to price a more durable geopolitical de-escalation scenario.
Such a development would likely support broader risk appetite across financial markets while simultaneously easing inflationary pressures and reducing some of the upside pressure on Treasury yields and the US Dollar.
Written by Razan Hilal, CMT
Follow on X: @RH_Waves







Web Trader platform
Our sophisticated web-based platform is packed with features.
Open an account today
Experience award-winning platforms with fast and secure execution.
Economic calendar
Related articles

Euro Short-term Outlook: EUR/USD Pullback Nears Pivotal Uptrend Support 8 28 2026
Warsh's comments accelerated the EUR/USD selloff, raising the stakes as buyers look to stabilize the broader recovery.


Nasdaq 100 Forecast: NDX slips ahead of Fed Chair Warsh’s speech
U.S. stocks are edging lower on Friday, giving back some of yesterday's gains after Nvidia's strong outlook revived the tech trade. The focus has now shifted firmly to Fed Chair Kevin Warsh's Jackson Hole speech, with investors looking for more clarity on the outlook for interest rates.


AUD/CAD breakout puts the Bradman barrier in sight
A bullish breakout has pushed AUD/CAD to its highest level since early 2021. Whether it can clear 0.9994 may determine if the move extends well above parity.
