


Crude Oil Forecast: US-Iran Pause Drives -7% WTI Drop - Will it Reverse?
The oil market has opened the week with some relief on the supply side after the United States and Iran paused military strikes over the weekend - How long will it last?
Written by
Matt Weller
Head of Market Research
Crude Oil Key Points
- The oil market is falling -7% after the United States and Iran paused military strikes over the weekend.
- Traders may continue to view near-term dips in oil prices as a buying opportunity unless there’s significant progress toward a durable peace deal in the Middle East.
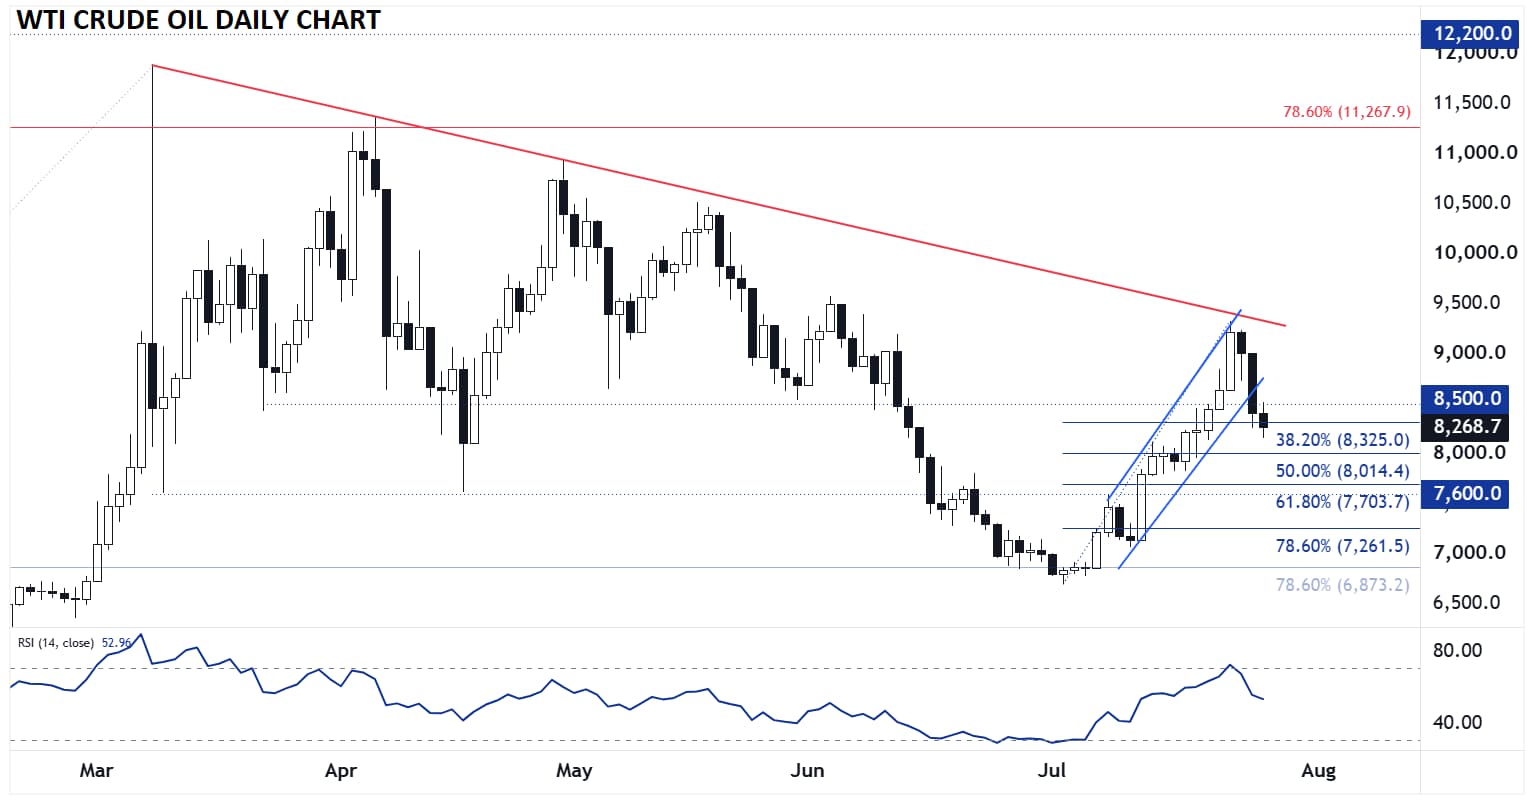
- WTI is probing the 38.2% Fibonacci retracement of the July rally at $83.25; if that level gives way, a deeper retracement toward $80.00 (50%) or $77.00 (61.8%) becomes more likely.
New week, new oil market?
The oil market has opened the week with some relief on the supply side after the United States and Iran paused military strikes over the weekend.
The break in hostilities has raised hopes that tanker traffic through the Strait of Hormuz can begin to normalize, but the underlying logistics remain fragile. Shipments through the strait have been severely disrupted, while Houthi attacks on Saudi tankers in the Red Sea have also threatened the main alternative route. India’s MRPL has now instructed suppliers to avoid both waterways when delivering spot crude, highlighting the practical difficulties refiners still face in securing reliable cargoes.
In essence, Iran understands that its leverage over the Strait of Hormuz remains its “Trump card” in negotiating concessions, so it’s unlikely to fully re-open the Strait without conditions until the country believes it has significantly deterred the threat of future attacks.
Downstream supply in the oil market is also tight. US refineries are operating near capacity to offset reduced international fuel flows and disruptions to Russian refining. That leaves the system vulnerable to unexpected outages during the summer demand season. Domestic data offered a slightly softer picture: US crude, gasoline and distillate inventories all increased in the latest week, helped by higher crude imports and weaker exports. Refinery utilization nevertheless remained elevated at 96.1%.
Ultimately, time favors Iran’s long-term goals and as such, traders may continue to view near-term dips in oil prices as a buying opportunity unless there’s significant progress toward a durable peace deal in the Middle East.
Crude Oil Technical Analysis: WTI Daily Chart
Source: Tradingview, StoneX
Looking at the chart, WTI Crude Oil prices have been respecting the relevant technical structures remarkably well, despite the recent volatility. After surging to test the bearish trend line off the highs set early in the US-Iran conflict, WTI reversed lower late last week and has now broken down below its near-term bullish channel.
While we can’t necessarily handicap the day-to-day headlines, we can monitor the objective technical levels to evaluate market sentiment. As we go to press, WTI is probing the 38.2% Fibonacci retracement of the July rally at $83.25; if that level gives way, a deeper retracement toward $80.00 (50%) or $77.00 (61.8%) becomes more likely. Meanwhile, re-escalation could quickly erase the weekend swoon, with the psychologically-significant $90 level representing the first logical target to the upside.
-- Written by Matt Weller, Global Head of Research
Check out Matt’s Daily Market Update videos on YouTube and be sure to follow Matt on Twitter: @MWellerFX







Web Trader platform
Our sophisticated web-based platform is packed with features.
Open an account today
Experience award-winning platforms with fast and secure execution.
Economic calendar
Related articles

Euro Short-term Outlook: EUR/USD Pullback Nears Pivotal Uptrend Support 8 28 2026
Warsh's comments accelerated the EUR/USD selloff, raising the stakes as buyers look to stabilize the broader recovery.


Nasdaq 100 Forecast: NDX slips ahead of Fed Chair Warsh’s speech
U.S. stocks are edging lower on Friday, giving back some of yesterday's gains after Nvidia's strong outlook revived the tech trade. The focus has now shifted firmly to Fed Chair Kevin Warsh's Jackson Hole speech, with investors looking for more clarity on the outlook for interest rates.


AUD/CAD breakout puts the Bradman barrier in sight
A bullish breakout has pushed AUD/CAD to its highest level since early 2021. Whether it can clear 0.9994 may determine if the move extends well above parity.
