


Crude Oil Outlook: What the 1973 Oil Embargo Tells Us About the 2026 Hormuz Crisis
Crude Oil Outlook: Comparing the 1973 Arab Oil Embargo with the 2026 Strait of Hormuz crisis helps put today's market volatility into historical perspective while filtering out much of the daily headline noise.
Written by
Razan Hilal
Market Analyst
Comparing the 1973 Arab Oil Embargo with the 2026 Strait of Hormuz crisis helps put today's market volatility into historical perspective and filters out much of the daily headline noise.
While both events have generated significant disruptions across global energy markets, the source of leverage is fundamentally different. The 1973 crisis was driven by oil-producing nations restricting exports. In contrast, the 2026 crisis centers on the disruption of one of the world's most important energy transit corridors. The question is no longer simply whether oil exists, but whether it can safely reach consumers.
- In 1973, the market feared a shortage of supply.
- In 2026, the market increasingly fears a breakdown in transportation, logistics, and maritime security.
What Happened in 1973?
The 1973-74 Arab Oil Embargo followed the Yom Kippur War, when several Arab oil producers restricted exports to countries supporting Israel.
The resulting supply shock caused crude oil prices to roughly quadruple, fueling inflation, slowing economic growth, and contributing to the stagflation that defined much of the 1970s.
More importantly, the crisis fundamentally reshaped global energy policy. Governments and international institutions developed a framework designed specifically to reduce the vulnerability of energy markets to producer-led supply disruptions.
Among the most significant developments were:
- The establishment of the U.S. Strategic Petroleum Reserve (SPR).
- The creation of the International Energy Agency (IEA).
- OPEC's rise as a dominant force in global energy markets.
- The growing role of the U.S. dollar in global crude oil transactions.
For more than five decades, these measures formed the backbone of global energy security.
Why Is 2026 Different?
The leverage in today's crisis is not crude oil production itself; it is the ability to transport that crude through one of the world's most important maritime chokepoints.
A producer can increase output, but if tankers cannot safely transit the Strait of Hormuz, additional production offers little immediate relief.
This distinction changes how investors should think about some of the traditional solutions.
- Strategic petroleum reserves helped cushion the initial shock, but prolonged disruptions would steadily reduce that buffer.
- OPEC can adjust production targets, but additional supply offers limited relief if exports cannot safely leave the Gulf.
At the same time, the crisis is raising broader questions around maritime security, shipping insurance, transit routes, and the future evolution of global energy payment systems.
In many respects, the Hormuz crisis reveals a potential vulnerability in the modern energy system. The world spent decades building tools to address supply shortages while paying comparatively less attention to the security of the infrastructure that moves those supplies.
In that sense, the 2026 crisis may be exposing a weakness that the post-1973 energy-security framework was never designed to solve.
What Could Change?
Just as the 1973 oil embargo led to the creation of new institutions and energy-security frameworks, the 2026 Hormuz crisis may eventually lead to a different generation of energy-security frameworks.
Future priorities may include:
- Enhanced multinational maritime-security frameworks.
- Expanded pipeline infrastructure that bypasses vulnerable chokepoints.
- New insurance, financing, and risk-sharing mechanisms for energy transportation.
- Enhanced regional security cooperation around strategic waterways.
Any lasting resolution will depend on more than military de-escalation alone.
It will likely require agreements on maritime security, regional stability, sanctions, freedom of navigation, and the broader diplomatic issues that continue to shape relations between the United States, Iran, and its regional partners.
The Bigger Picture
The most important lesson from comparing 1973 and 2026 is that the nature of energy security appears to be evolving.
- In 1973, energy security largely depended on who controlled the oil.
- In 2026, energy security increasingly depends on who controls, protects, and finances the infrastructure through which that oil moves.
It remains uncertain what the next generation of energy-security frameworks will look like. However, the timing of any structural shift may become visible through the following technical scenarios, as prolonged disruptions could sustain inflationary pressures, while improving energy flows would likely ease inflation risks and unwind part of the geopolitical risk premium.
Crude Oil Outlook: 3-Month Time Frame – Log Scale
Source: Trading view
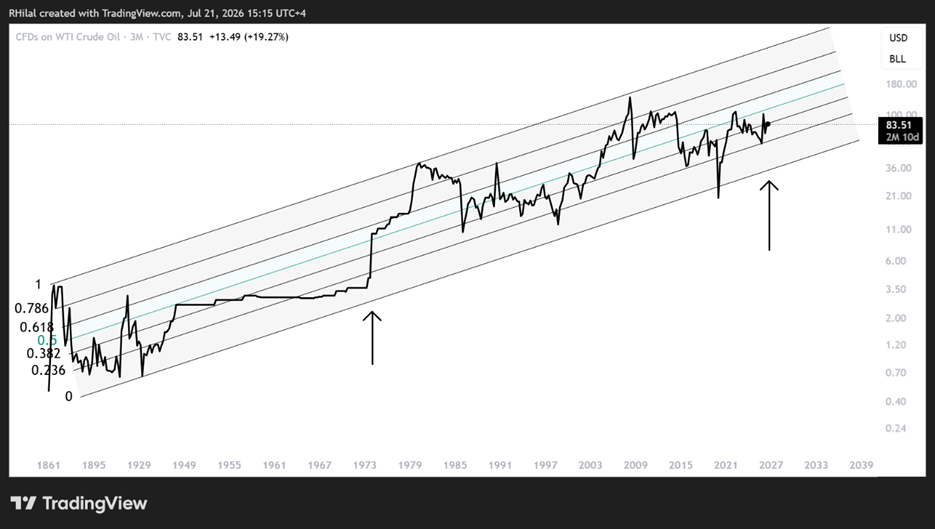
On a long-term logarithmic basis, crude oil continues to respect the boundaries of a multi-decade ascending channel. The major pullback from the 2026 highs found support near the channel midpoint around $120, reinforcing the importance of this long-term structure.
The 1973 oil shock saw crude prices rise roughly 400%, from around $3 to $12 per barrel. By comparison, the 2026 Hormuz disruption has lifted prices from roughly $60 to $120, a move of nearly 100%. Although the percentage gain is smaller than that of 1973, today's rally is unfolding in a market that remains highly sensitive to disruptions in global energy transportation.
From a technical perspective, price action now appears to be one major level away from confirming another critical supply disruption and a retest to the channel midpoint, the $120 high. That level is the $95 resistance area, illustrated on the daily chart below.
Crude Oil Outlook: Daily Time Frame – Log Scale
Source: Trading view
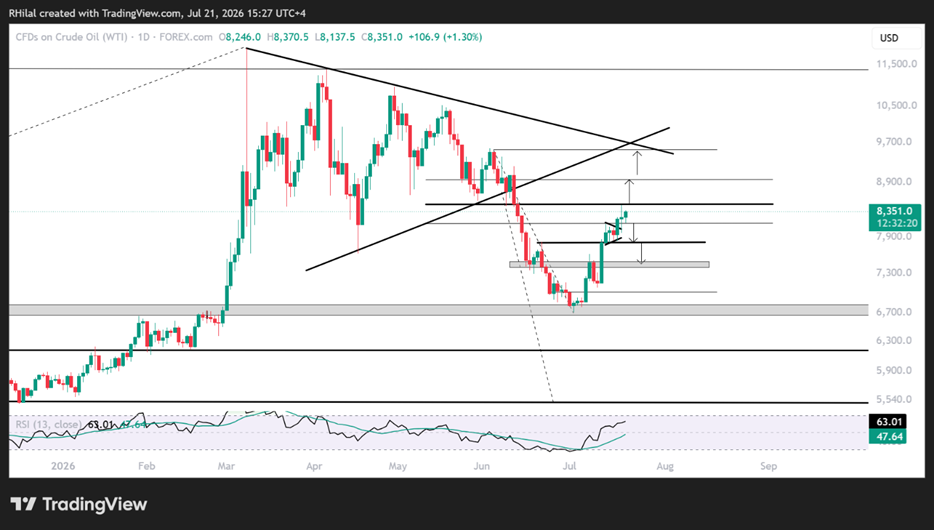
WTI crude oil has rebounded more than 26% from the $66 low and is now testing the 61.8% Fibonacci retracement of the June-July decline, just below the $85 resistance area.
Price has entered another short-term consolidation beneath resistance as diplomatic talks between the United States and Iran begin. Holding above current levels continues to support the bullish case while risks surrounding the Strait of Hormuz remain elevated.
Key resistance levels
Should crude oil break above $85, the following levels become key:
- $89.80: 78.6% Fibonacci retracement.
- $95: 100% retracement, aligning with the lower boundary of the March-June consolidation range. A rejection there would reinforce the probability of another corrective pullback. A decisive breakout would instead shift focus back toward the yearly highs.
Downside risks
Failure to hold above $81, followed by breaks below $78 and $73.50, would expose $68 and $66.50 once again.
This remains a critical technical support zone, aligning with:
- Multi-year support dating back to 2019.
- The 78.6% Fibonacci retracement of the 2026 rally.
Although the recent rebound interrupted downside momentum, the broader bearish structure remains intact following the breakdown below the March-June consolidation range.
If $66 fails to hold, downside pressure could initially extend toward $61 before any meaningful recovery develops. A decisive break below $61 would strengthen the case for a move toward the $55 objective outlined in my second-half outlook.
While oversold conditions have triggered a short-term recovery, developments surrounding the Strait of Hormuz are likely to determine whether the rebound extends or whether the broader oversupply narrative re-emerges into year-end.
Written by Razan Hilal, CMT
Follow on X: @Rh_waves







Web Trader platform
Our sophisticated web-based platform is packed with features.
Open an account today
Experience award-winning platforms with fast and secure execution.
Economic calendar
Related articles

Euro Short-term Outlook: EUR/USD Pullback Nears Pivotal Uptrend Support 8 28 2026
Warsh's comments accelerated the EUR/USD selloff, raising the stakes as buyers look to stabilize the broader recovery.


Nasdaq 100 Forecast: NDX slips ahead of Fed Chair Warsh’s speech
U.S. stocks are edging lower on Friday, giving back some of yesterday's gains after Nvidia's strong outlook revived the tech trade. The focus has now shifted firmly to Fed Chair Kevin Warsh's Jackson Hole speech, with investors looking for more clarity on the outlook for interest rates.


AUD/CAD breakout puts the Bradman barrier in sight
A bullish breakout has pushed AUD/CAD to its highest level since early 2021. Whether it can clear 0.9994 may determine if the move extends well above parity.
