

Crude oil unwind hits a hurdle
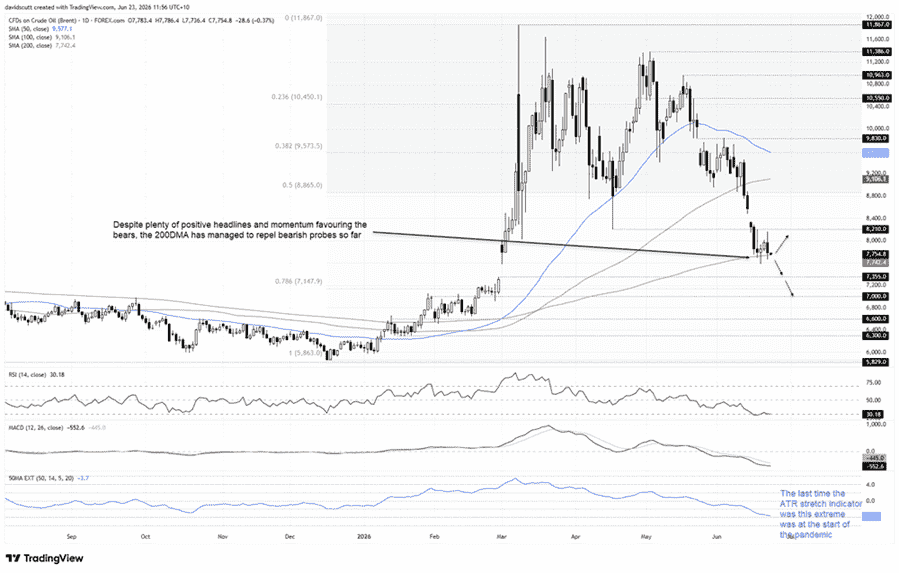
The headlines remain overwhelmingly bearish for crude, yet repeated tests of the 200-day moving average have failed to deliver a decisive break lower. That makes the level a crucial gauge of sentiment in the sessions ahead.
Written by
David Scutt
Market Analyst
- Hormuz optimism continues to pressure crude prices
- Repeated 200DMA tests fail to deliver breakdown
- Stretch indicators warn squeeze risk remains
Good news keeps coming
Bears have had it all their own way in crude recently. An improving outlook for relations between the United States and Iran has helped fuel an abrupt unwind in prices, encouraging traders to contemplate a return to levels seen before the war erupted.
But after such a sharp decline, it's worth remembering we've seen plenty of false dawns during this conflict. Periods of optimism have repeatedly been followed by renewed escalation, and while everything appears fantastic right now, history and commonsense suggests another setback can't be ruled out.
Given how extended the move has become, any development that derails hopes for a lasting agreement could easily spark a squeeze. That's why I'm watching the 200-day moving average closely in the near term.
200DMA the line in the sand
Source: TradingView
Crude continues to gravitate towards it, acting like a magnet as optimism surrounding the peace process builds. However, it's been tested repeatedly in recent sessions, but none of the breaks have stuck, reinforcing its importance as the downside level to watch.
For bears looking for an extension of the downside move, it's not enough to see crude probe beneath the 200-day moving average; they need to see one of those breaks stick, preferably accompanied by a close beneath the recent low near $76 a barrel. If that were to occur, attention would likely shift towards $73.55, where crude settled on the Friday before fighting erupted in late February.
Should the gap be filled, $70 a barrel becomes an obvious downside target, having repeatedly acted as both support and resistance over the past year. Below there, $66 warrants attention, having capped rallies and provided support on multiple occasions earlier this year.
Given the selloff has been driven by the removal of geopolitical risk premium, a return to those levels would suggest the market believes the impact on supply has been neutralised, which comes across as optimistic given ongoing downstream supply disruptions and need to replenish strategic reserves.
From a momentum perspective, the oscillators continue to favour downside. RSI (14) is trending lower and sits near 30, while MACD remains in negative territory below its signal line. The one note of caution is how rapid crude's unwind has become, with the ATR stretch indicator in blue sitting at levels not seen since the start of the pandemic in early 2020.
Related tags:







Web Trader platform
Our sophisticated web-based platform is packed with features.
Open an account today
Experience award-winning platforms with fast and secure execution.
Economic calendar
Related articles

USD/JPY weekly outlook: Payrolls may challenge the Fed’s hawkish reset
USD/JPY has finally woken from its slumber. Payrolls now loom as the key test of whether the latest hawkish repricing sticks or sinks.

Euro Short-term Outlook: EUR/USD Pullback Nears Pivotal Uptrend Support 8 28 2026
Warsh's comments accelerated the EUR/USD selloff, raising the stakes as buyers look to stabilize the broader recovery.


Gold and S&P 500 analysis: What now after Warsh’s hawkish speech?
The dollar surged across the board after the Fed Chair Kevin Warsh surprised with a hawkish-leaning speech at the Jackson Hole summit. All the bearish dollar bets that had been accumulated since last Friday on the back of data weakness and bond market troubles had to be squared and that triggered a short squeeze rally for the dollar. Gold and silver dropped, as a result, as too did bitcoin, while US indices were giving back earlier gains.
