


Crude Oil Weekly Outlook: Chart Leans Bearish on US-Iran Peace Deal Hopes
Crude Oil Weekly Outlook: Crude oil remains below key support and the multi-month consolidation range as markets assess a potential US-Iran peace deal. Explore key levels and scenarios ahead.
Written by
Razan Hilal
Market Analyst
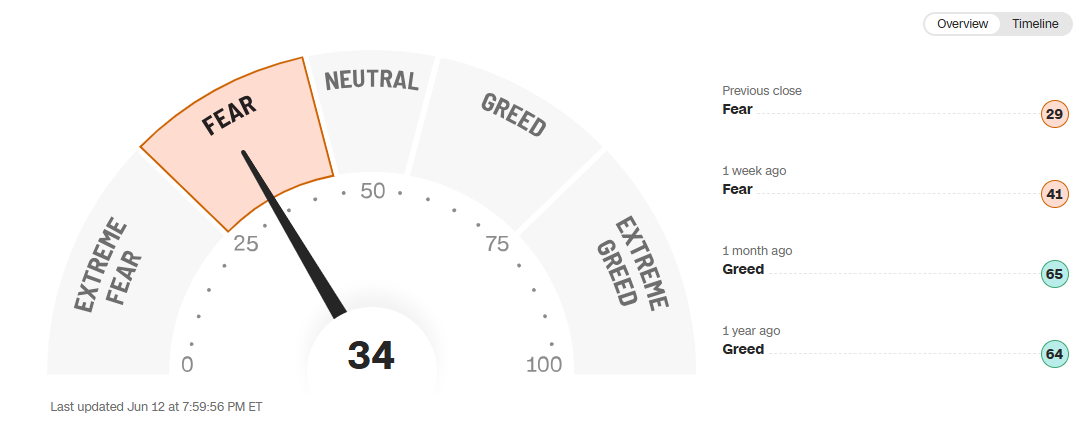
Crude oil continues to lean bearish below the multi-month consolidation range and the $88 level as markets price in hopes of a confirmed US-Iran peace deal. Key technical levels remain critical in determining what comes next, as market sentiment remains in fear territory while price action tests another important support level at $82.
CNN Fear and Greed Index
Source: CNN
The latest move follows President Trump's announcement ordering an immediate end to military operations, removing the naval blockade, while claiming that an official agreement has been reached. However, markets remain cautious as they await confirmation from Iran before fully embracing the peace narrative.
Given the growing uncertainty surrounding the headlines, particularly whether Iran confirms Trump's claims regarding a peace agreement in a highly sensitive nuclear talk environment, the focus will remain on activity through the Strait of Hormuz and the crude oil chart itself, which continues to reflect the real flow of capital behind the headlines, and impact the broader markets.
Crude Oil Weekly Outlook: Weekly Time Frame – Log Scale
Source: TradingView
Why $85 Remains the Key Level
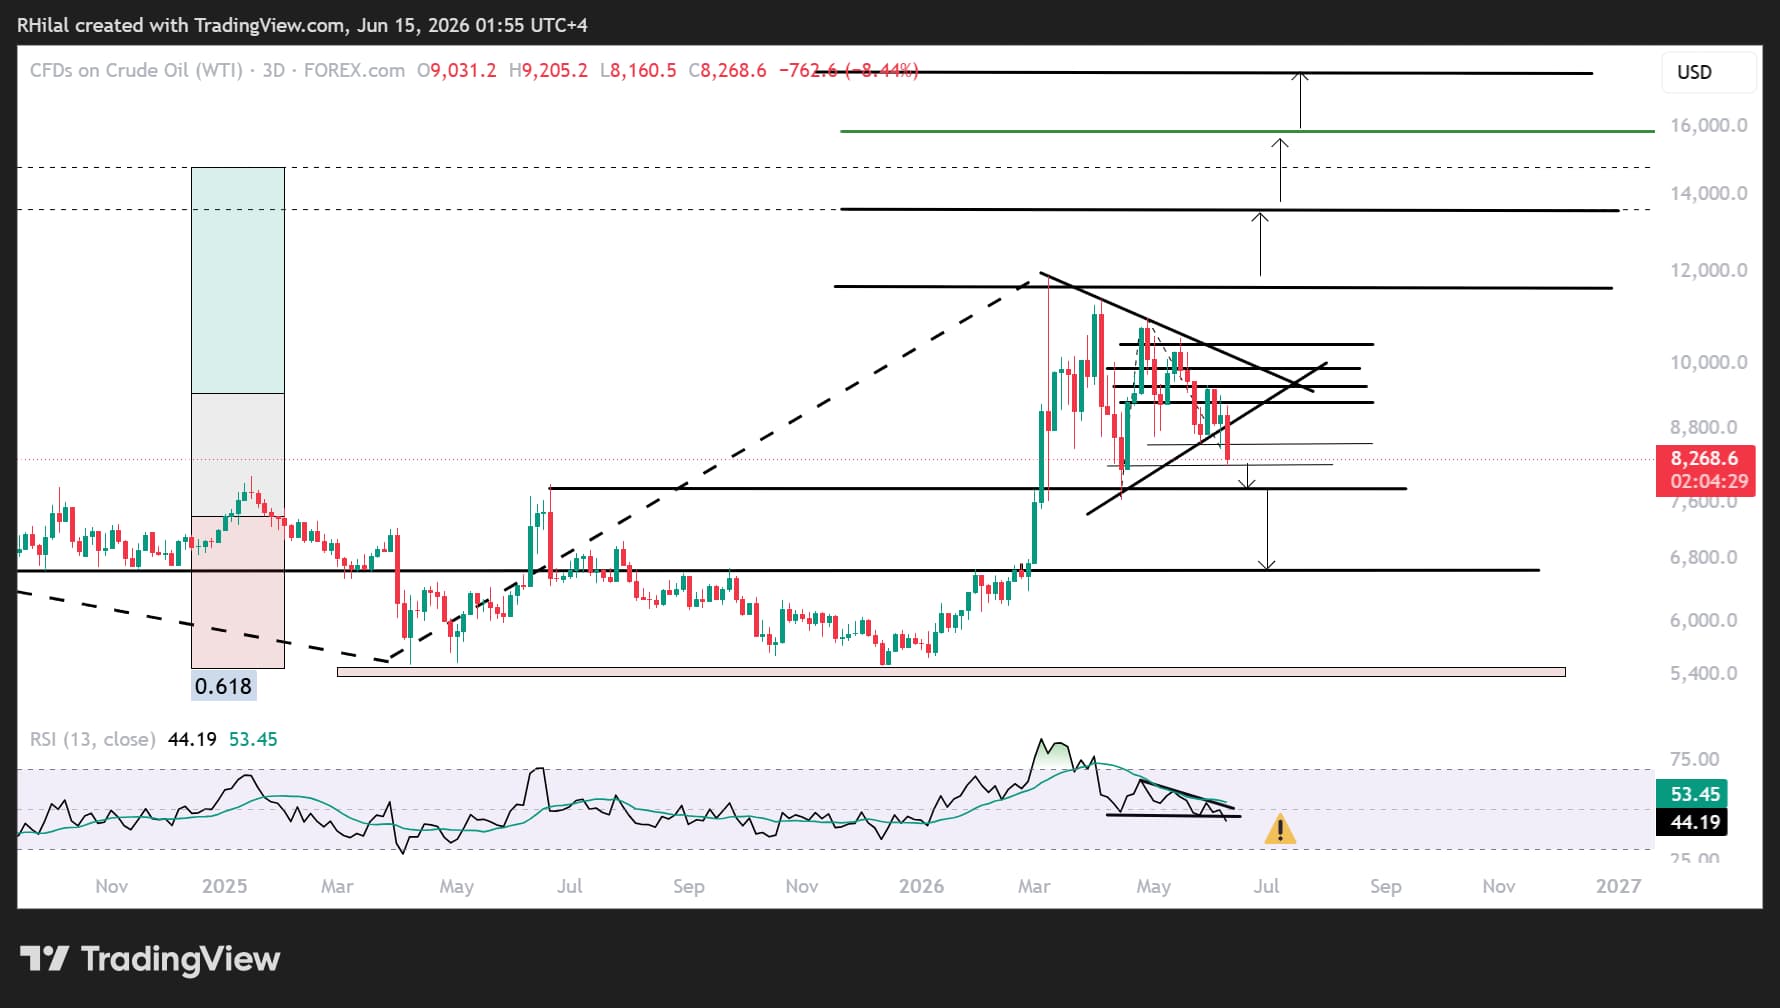
The dominant outlook for crude oil remains the risk of a confirmed bearish breakout below the multi-month consolidation pattern that has been developing since March 2026.
The critical level to monitor is the $85 support zone, which aligns with the 50% Fibonacci extension of the June 2022–December 2025–March 2026 price cycle.
As long as price action remains below this level, the bias continues to favor further downside.
Bullish Momentum Has Not Completely Faded
Despite recent weakness, bullish risks remain present.
Weekly RSI and momentum indicators continue to hold near the neutral 50 level, although leaning towards a multi month consolidation breakout as well, suggesting that the latest decline could evolve into a false triangle breakdown rather than a confirmed bearish continuation.
This scenario becomes increasingly relevant if the $82 support level holds, the $85 is reclaimed, and Iran refutes or delays confirmation of Trump's peace-deal claims once again.
Bearish Scenario: Breakdown Below $82
A sustained move below $82 would confirm a bearish bias and expose crude oil prices to the $78–$74 zone, corresponding to the June 2025 highs recorded during last year's Middle East conflict.
Beyond that, the market could extend losses toward the multi-year support and resistance zone near $67, potentially easing energy-market pressures across the global economy. This scenario would likely unfold with a bearish consolidation breakout for the weekly RSI towards the yearly oversold lows.
Bullish Scenario: Recovery Above $85–$92
If crude oil successfully reclaims the $85 level and advances toward the midpoint of the consolidation range near $92–$96, bullish momentum could strengthen considerably.
A move back toward $100 would become increasingly likely, with additional upside targets at:
- $104
- $115
- $120
These levels are derived from Fibonacci extension measurements of the April–May price cycle.
Long-Term Upside Targets
A sustained breakout above $120 would expose the longer-term resistance zones near:
- $135
- $157
These levels are based on Fibonacci extensions measured from the broader 2020–2022–2025 cycle.
To follow this analysis live, I discuss these scenarios during my daily MENA Market Call webinars.
Register for the next webinar here:
https://attendee.gotowebinar.com/register/1712903232130037596
Written by Razan Hilal, CMT
Follow on X: @Rh_waves







Web Trader platform
Our sophisticated web-based platform is packed with features.
Open an account today
Experience award-winning platforms with fast and secure execution.
Economic calendar
Related articles

Euro Short-term Outlook: EUR/USD Pullback Nears Pivotal Uptrend Support 8 28 2026
Warsh's comments accelerated the EUR/USD selloff, raising the stakes as buyers look to stabilize the broader recovery.


Nasdaq 100 Forecast: NDX slips ahead of Fed Chair Warsh’s speech
U.S. stocks are edging lower on Friday, giving back some of yesterday's gains after Nvidia's strong outlook revived the tech trade. The focus has now shifted firmly to Fed Chair Kevin Warsh's Jackson Hole speech, with investors looking for more clarity on the outlook for interest rates.


AUD/CAD breakout puts the Bradman barrier in sight
A bullish breakout has pushed AUD/CAD to its highest level since early 2021. Whether it can clear 0.9994 may determine if the move extends well above parity.
