


Crude Oil Weekly Outlook: WTI Holds Above 7-Month Resistance
Crude Oil Weekly Outlook: WTI holds above 7-month resistance as traffic through the Strait of Hormuz remains constrained and US-Iran tensions escalate. Key technical scenarios remain in focus as upside risks mount.
Written by
Razan Hilal
Market Analyst
Crude oil prices are holding above a 7-month resistance level that capped price action with lower highs since March 2026. The bullish continuation scenario has gained momentum after the US military recently struck three Iranian oil tankers. According to tanker-traffic data observed by Kpler, only one ship was recorded passing through the Strait of Hormuz on Saturday, further intensifying concerns over supply disruptions.
From a cross-asset perspective, the Energy Select Sector SPDR Fund (XLE) is holding above a major 2008–2026 resistance level and remains in a strong bullish zone. Brent crude, however, continues to lag, with price action still below a significant 7-month resistance level.
Overall, two charts maintain a positive bias, while one remains neutral-to-positive. This keeps bullish risks, inflationary pressures, and broader risk-off concerns in focus.
Key Scenarios in Focus
WTI Weekly Outlook: 3-Day Time Frame — Log Scale
Source: TradingView
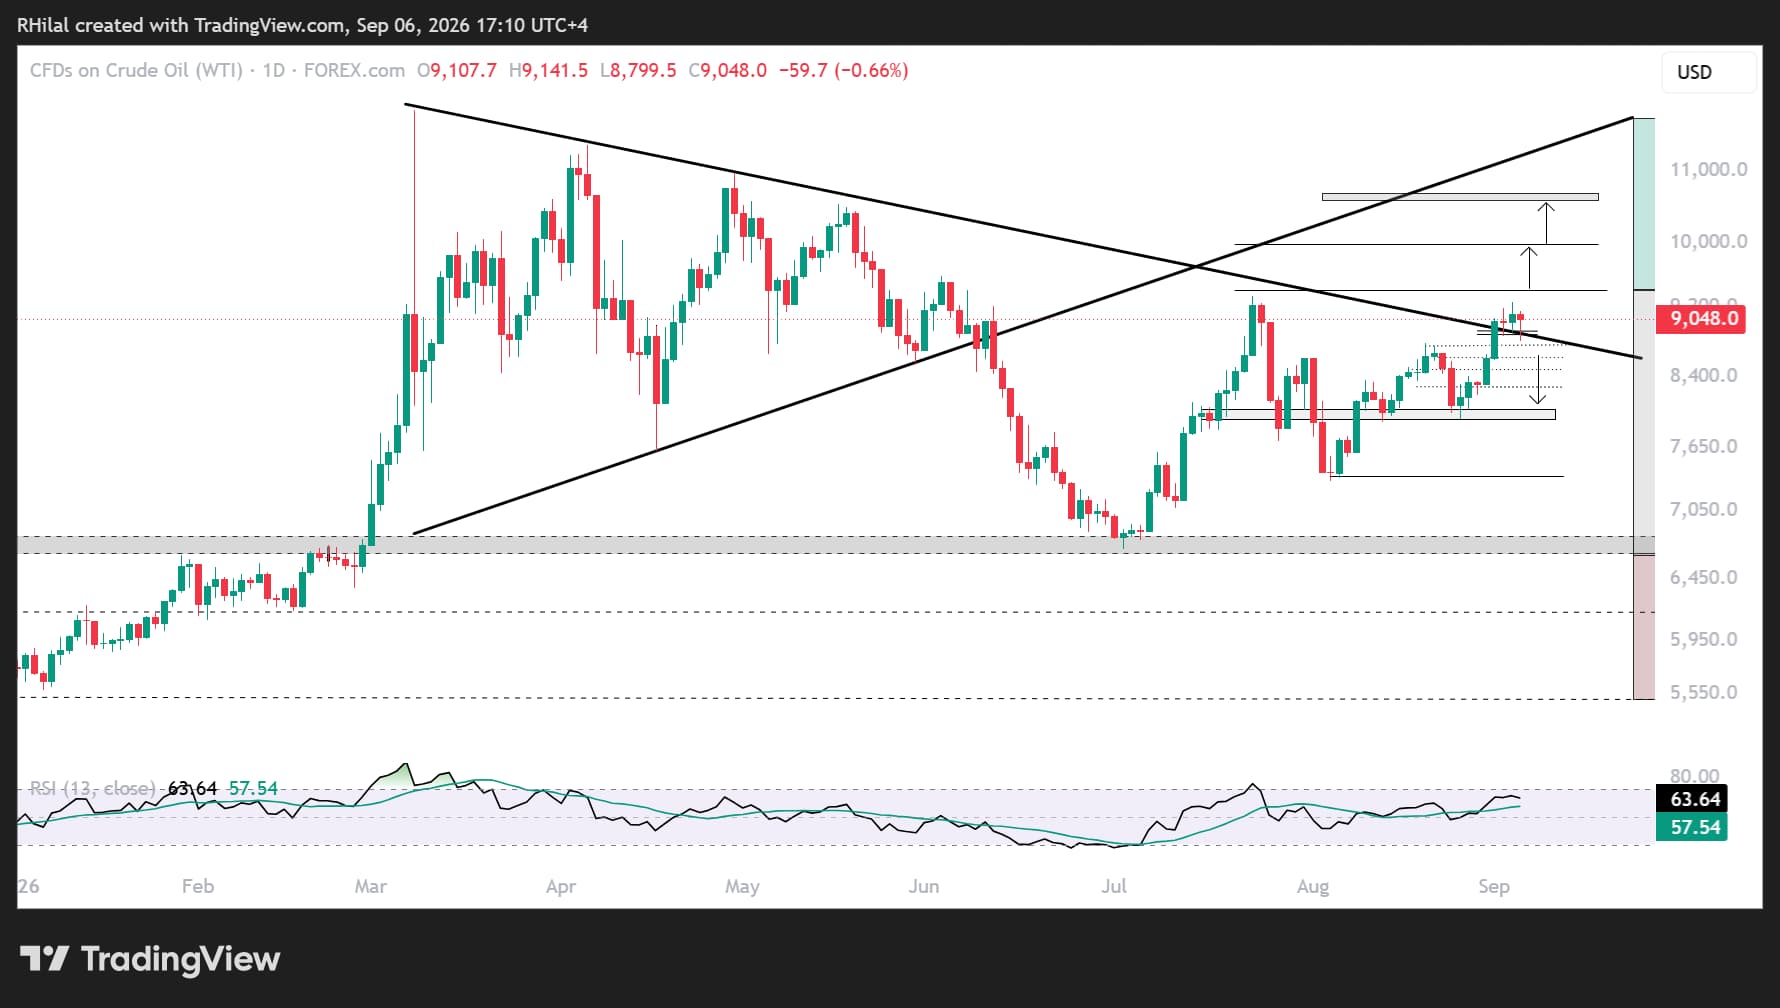
WTI price action is holding above the 7-month resistance level near $88 per barrel, which capped prices from March 2026 onward. To reinforce the escalation and supply-crunch scenario, WTI needs to reclaim the July 2026 high near $94.
On the downside, a move back below the multi-month barrier would support a de-escalation scenario and reintroduce a bearish bias.
Bullish scenario: A breakout above $94 would reinforce the bullish outlook and escalation narrative, targeting the Fibonacci extension levels of the July–August 2026 cycle near $99.80 and $107. These represent the 100% and 127% extension levels and sit close to the yearly highs.
Bearish scenario: A breakdown below $88, corresponding to the 23.6% retracement of the July–August advance, could trigger a deeper decline toward short-term levels at $87.40, $86, and $84.30. A sustained move lower could expose longer-term support near $80–$79.
XLE Outlook: Monthly Time Frame — Log Scale
Source: TradingView
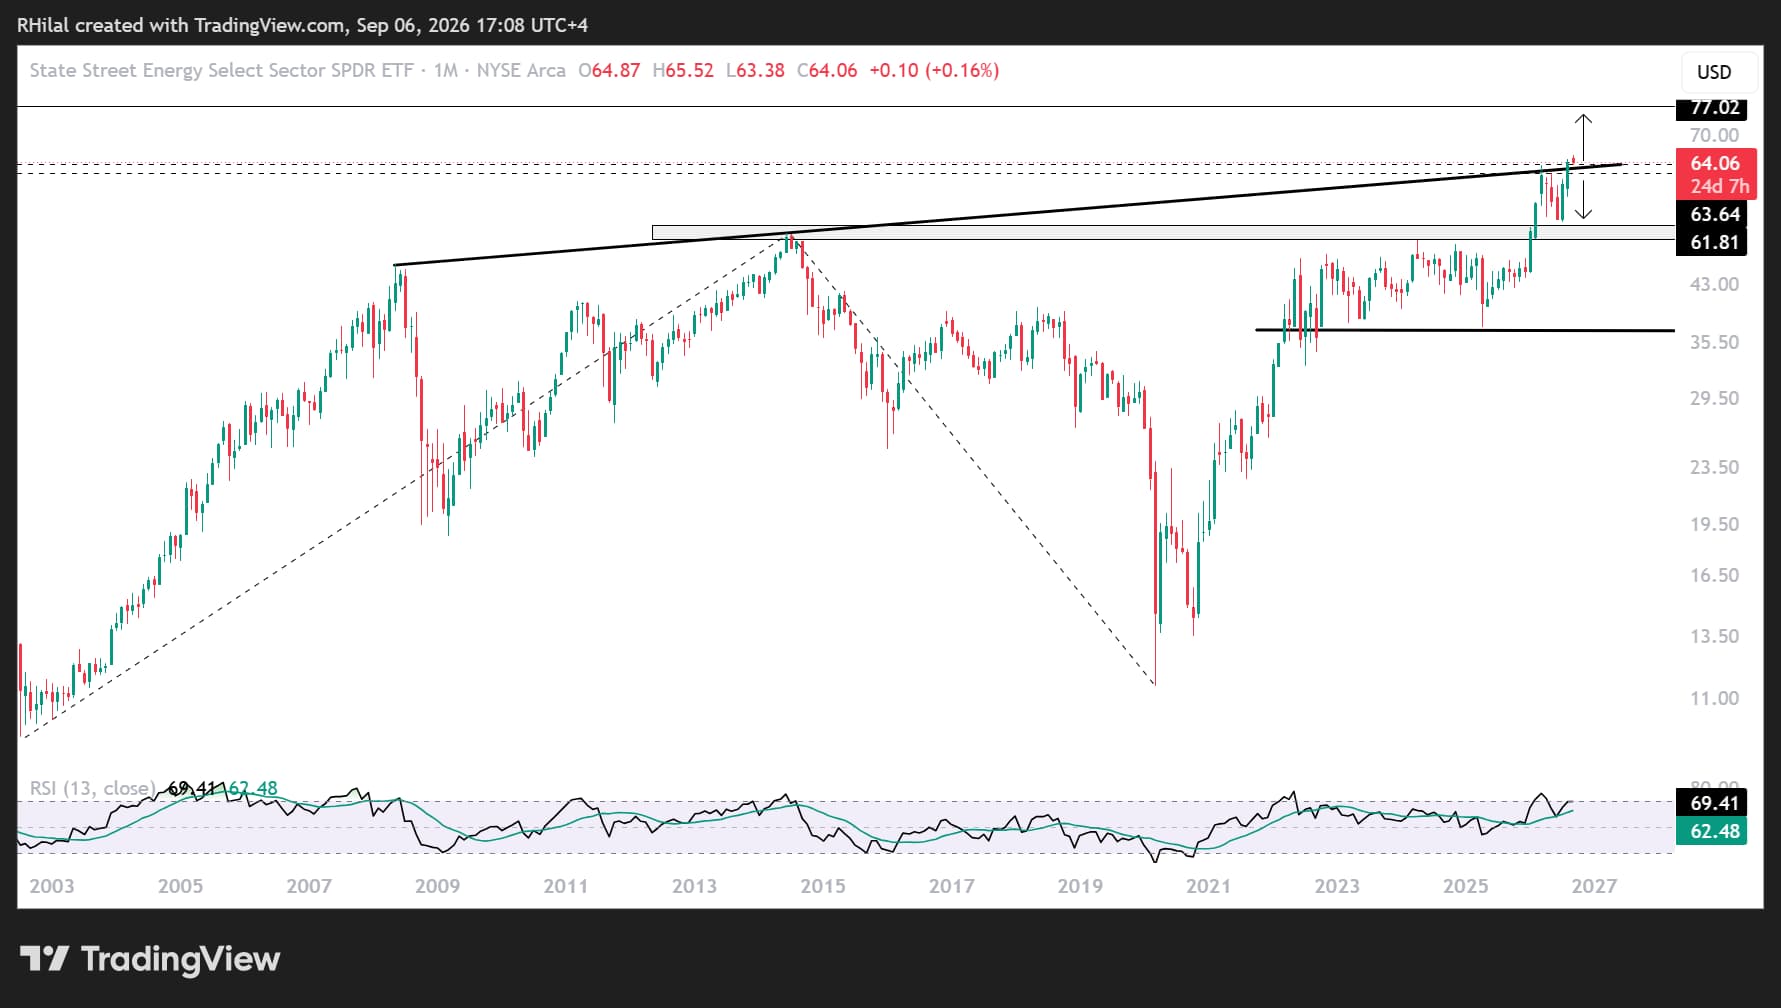
From an ETF perspective, XLE reflects the broader performance of the energy sector. Price action broke above a major 2008–2026 resistance level, which turned into support in September 2026. For now, that support is holding above $63.50.
The price structure remains consistent with persistent geopolitical tensions and signals potential long-term stress across the energy market.
Bullish scenario: Holding above $63.50 and reclaiming the $65.50 area would reinforce the bullish forecast and open the door to new record highs. Upside targets include the Fibonacci extension levels of the 2002–2014–2020 cycle near $68, $73, and $77.
This scenario would likely align with a broader escalation scenario.
Bearish scenario: A breakdown below the $61–$60 zone would reaffirm the strength of the multi-year resistance level and pressure XLE into another corrective cycle. This scenario would likely align with broader de-escalation across geopolitical tensions.
Brent Weekly Outlook: 3-Day Time Frame — Log Scale
Source: TradingView
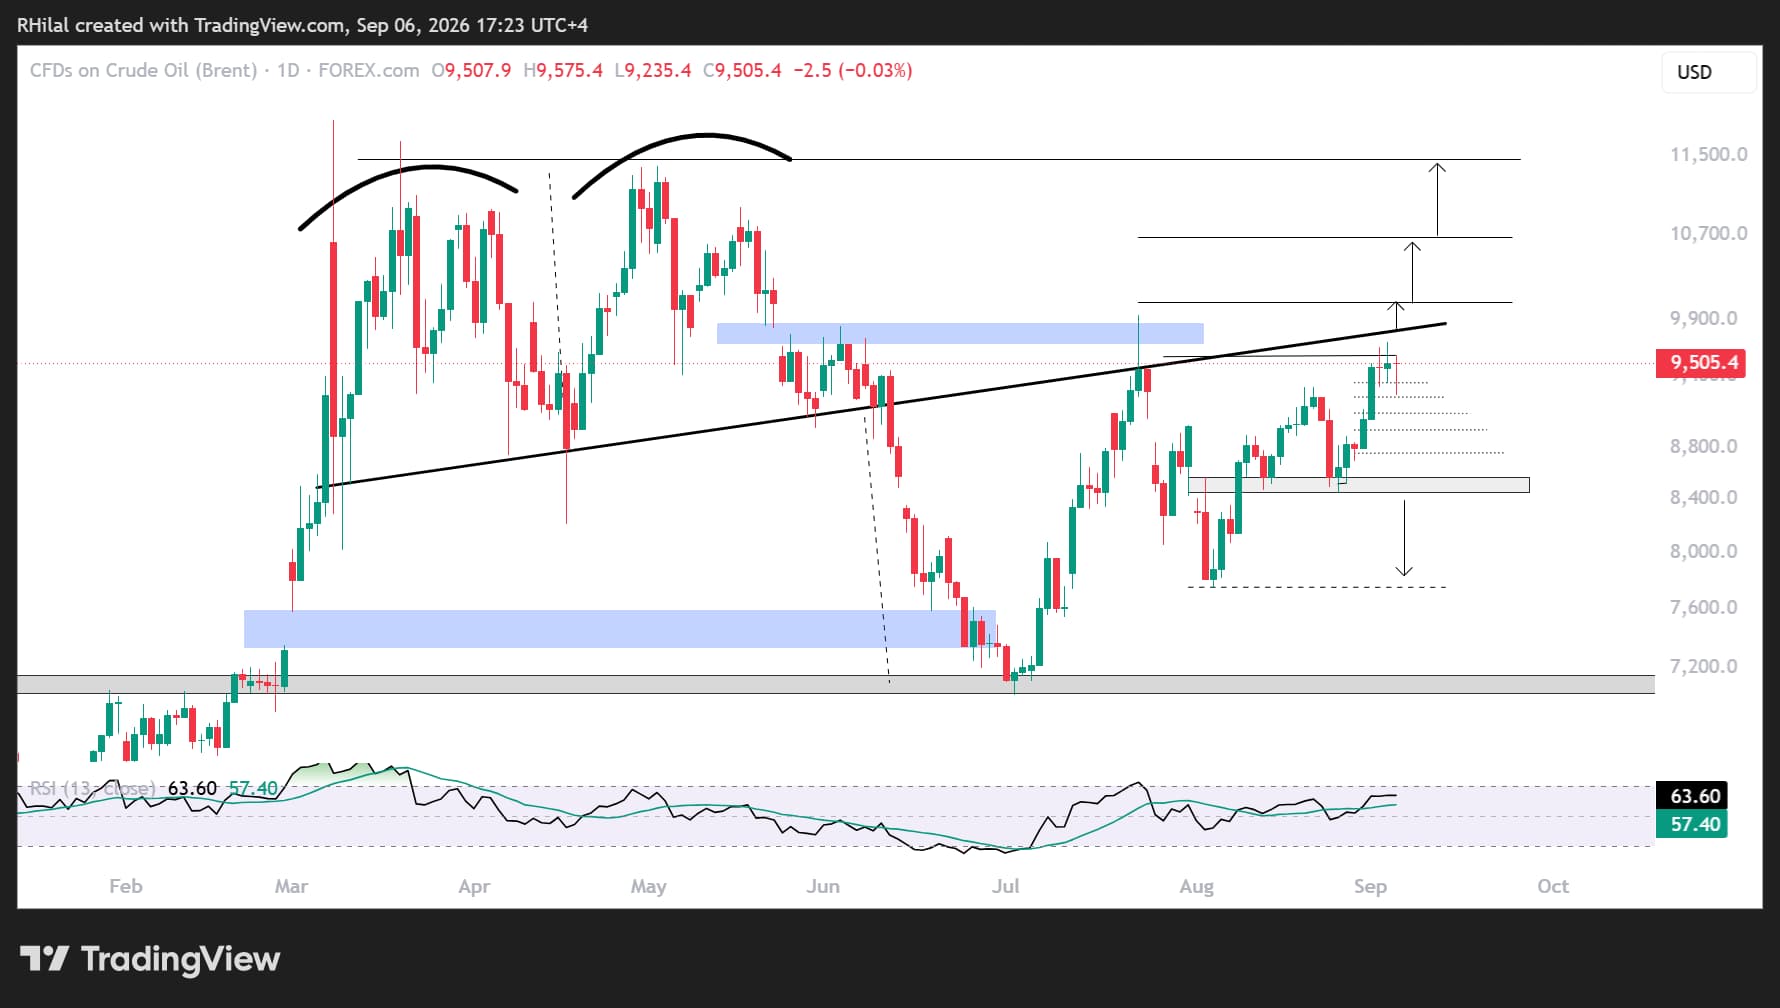
For Brent crude, a breakout above the multi-month and multi-year resistance zone has not yet been confirmed. This barrier represents the neckline of a double-top formation that triggered the sell-off in early June. The resistance is located near the July 2026 highs around $100 per barrel.
Bullish scenario: A breakout above the 7-month resistance level and the $100 mark would reinforce the bullish outlook and escalation narrative. This could open the way toward Fibonacci extension targets near $107 and $114, corresponding to the 100% and 127% extension levels and located close to the yearly highs.
Bearish scenario: A breakdown below $92, corresponding to the 38.2% retracement of the July–August advance, could trigger a deeper decline toward short-term levels at $90, $89, and $87.20. A more extended bearish move could develop below $84.60.
The narrative remains uncertain but tilted to the upside, with crude inventory drawdowns and escalating US–Iran tensions supporting price action as it attempts key breakouts. If confirmed, these moves could signal increasing stress across energy and broader markets heading into year-end.
Written by Razan Hilal, CMT
Follow on X: @Rh_waves
Latest market news











Web Trader platform
Our sophisticated web-based platform is packed with features.
Open an account today
Experience award-winning platforms with fast and secure execution.
Economic calendar
Related articles

Euro Technical Forecast: EUR/USD Holds the Line as September Battle Takes Shape 9 4 2026
EUR/USD has defended pivotal support for a second week, with ECB and U.S. inflation risk poised to test the developing September range.


USD/JPY weekly outlook: Payrolls may challenge the Fed’s hawkish reset
USD/JPY has finally woken from its slumber. Payrolls now loom as the key test of whether the latest hawkish repricing sticks or sinks.


Nasdaq 100 Forecast: NDX slips ahead of Fed Chair Warsh’s speech
U.S. stocks are edging lower on Friday, giving back some of yesterday's gains after Nvidia's strong outlook revived the tech trade. The focus has now shifted firmly to Fed Chair Kevin Warsh's Jackson Hole speech, with investors looking for more clarity on the outlook for interest rates.
