

Crypto Technical Analysis: Buying Strength Turns Selective
During the first days of September, mixed price action has once again become a dominant theme across the cryptocurrency market. Although some cryptocurrencies have managed to post meaningful gains, the market continues to display relatively stable movements without a clearly defined short-term direction
Written by
Julian Pineda
Market Analyst
During the first days of September, mixed price action has once again become a dominant theme across the cryptocurrency market. Although some cryptocurrencies have managed to post meaningful gains, the market continues to display relatively stable movements without a clearly defined short-term direction. This behavior suggests that demand is no longer as aligned as it was in previous sessions and that recent strength remains concentrated in specific cryptocurrencies rather than across the market. For now, a growing phase of indecision appears to be taking shape and, unless major assets begin breaking through important technical levels again, this lack of direction could remain an important feature of the market in the sessions ahead.
Performance of Major Cryptocurrencies
Source: Data - StoneX, Tradingview
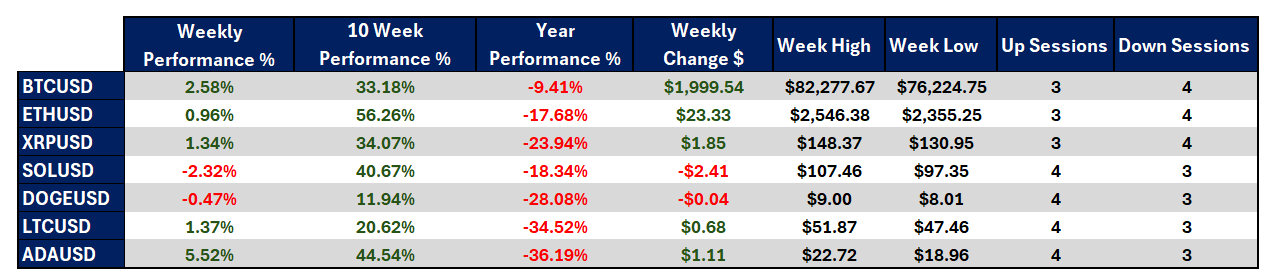
- During the week, a broadly neutral environment dominated the cryptocurrency market. Assets such as Ethereum, Ripple, Litecoin, and Dogecoin posted gains close to 1.00%, without showing a particularly consistent direction. The dominant pattern was one of stability rather than price action capable of breaking through important technical levels. One of the few cryptocurrencies that managed to stand out was Cardano, which delivered gains of more than 5.00% and ranked among the strongest performers of the week. In contrast, Solana posted losses close to 2.00%, reflecting a loss of momentum relative to the strength observed in previous weeks. Overall, the market failed to replicate the intensity of buying activity seen during earlier periods.
- Over the last 10 weeks, the cryptocurrency market has continued to display stability in medium-term price action and maintains a constructive bias relative to levels seen several weeks ago. However, this strength remains heavily dependent on a handful of assets. While cryptocurrencies such as Ethereum and Cardano continue to trade more than 40% above their levels from ten weeks ago, others such as Dogecoin have advanced only around 11.94%. This divergence highlights that the recovery remains uneven and that a significant portion of market strength continues to be concentrated in a relatively small group of cryptocurrencies.
- The longer-term picture remains less favorable and continues to suggest that there is still considerable ground to recover before 2026 can become a positive year for the sector. Year-to-date, major cryptocurrencies remain well below their opening levels for the year. Cardano continues to be the weakest performer, posting a decline of -36.19%, while Bitcoin remains down approximately -9.41%. This indicates that, although a significant recovery has taken place in recent weeks, the market still carries a broader element of weakness when viewed from a long-term perspective.
- As the market's benchmark asset, Bitcoin has also struggled to fully maintain the strength observed in previous weeks. Over the last week, BTC gained only around $2,000 and failed to establish itself consistently above the psychological $80,000 barrier. This situation reflects a slowdown in buying momentum and suggests that a period of indecision is beginning to gain importance across the market.
- More broadly, the cryptocurrency market continues to display an uneven profile. Bitcoin has been unable to transmit a consistent sense of strength to the rest of the sector, and the strongest gains remain concentrated in a handful of individual cryptocurrencies. As long as this situation persists, the lack of direction could continue to be a relevant feature of the market in the weeks ahead.
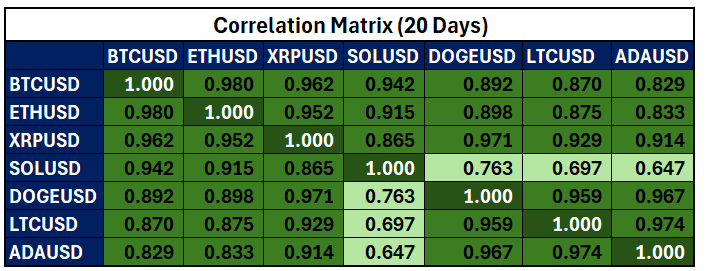
Colors range from red to green. Red indicates negative correlations and green indicates positive correlations.
Source: Data - StoneX, Tradingview
From a correlation perspective, a strong positive relationship between Bitcoin and the rest of the major cryptocurrencies remains evident. Most correlation coefficients continue to hold above 0.8, indicating that much of the market continues to move in line with the benchmark cryptocurrency over the last 20 trading sessions. As always, correlation coefficients can change over time.
This remains relevant because it suggests that the recent slowdown observed in Bitcoin is also beginning to spread across a large portion of the cryptocurrency market. Rather than signaling a complete loss of confidence, current correlation levels indicate that BTC's consolidation phase continues to be reflected throughout the broader sector. This helps explain why the week ended with mixed performance and weaker buying conviction compared with previous weeks.
As a result, the market environment continues to be characterized by weaker synchronization in bullish momentum. As long as Bitcoin struggles to regain traction, the lack of direction could continue to dominate most cryptocurrencies, and a broader phase of indecision may become increasingly relevant.
Bitcoin Struggles to Break Above Key Highs
Source: StoneX, Tradingview
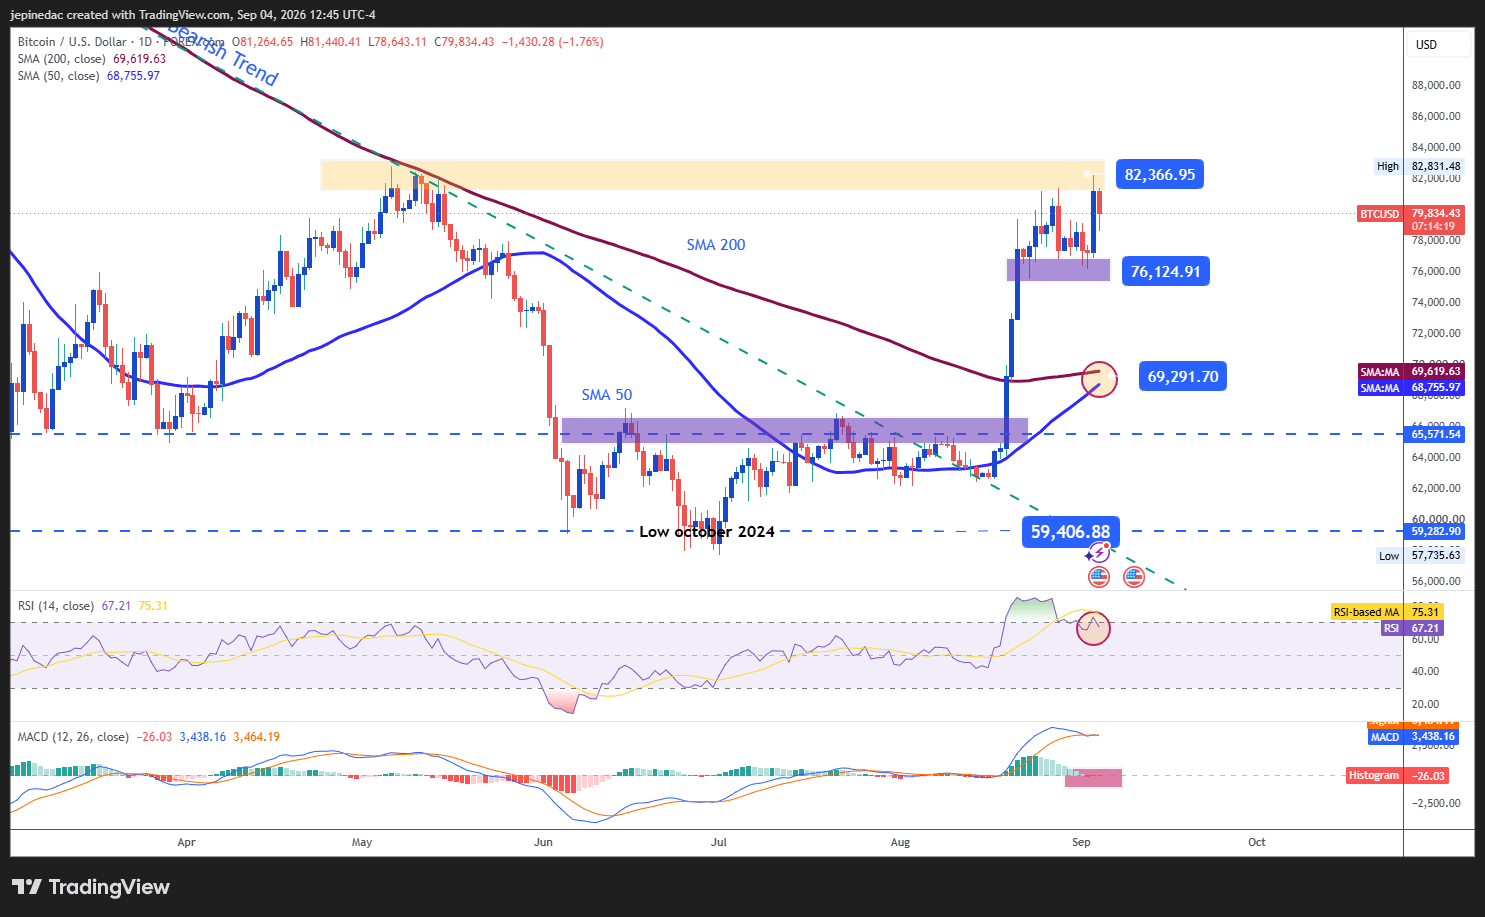
Although Bitcoin managed to maintain strong buying momentum in previous sessions, recent price action has once again begun to reflect a period of indecision on the chart. The price continues to face difficulties establishing itself above key resistance zones and, for now, remains far from confirming a more defined bullish structure. As long as this situation persists, room could remain for short-term pullbacks as well as a broader consolidation phase.
Indicators:
- The MACD continues to reflect a clear slowdown through a histogram that is gradually approaching the neutral 0 line. Meanwhile, the RSI has also retreated from recent highs, although it still remains near overbought territory around the 70 level. Together, these indicators point to fading buying momentum, while the RSI's elevated reading suggests that there is still room for corrective pullbacks following the strong rally observed in previous weeks.
Key Levels:
- $82,300 – Major Resistance: A high not seen in several months and the most important upside barrier on the chart. Sustained price action above this level could confirm the continuation of buying momentum and open the door to a more aggressive uptrend in the weeks ahead.
- $76,000 – Nearby Barrier: A level that coincides with important retracement areas observed in previous weeks and represents the closest support zone. It could become the primary reference level should bearish corrections begin to emerge in the coming sessions.
- $69,300 – Key Support: An area that coincides with both the 50-period and 200-period Simple Moving Averages and remains one of the most important support zones within the current structure. A move toward this level could weaken confidence in the recent recovery and once again favor a broader period of sideways trading.
Cardano Emerges as the Most Stable Cryptocurrency of the Week
Source: StoneX, Tradingview
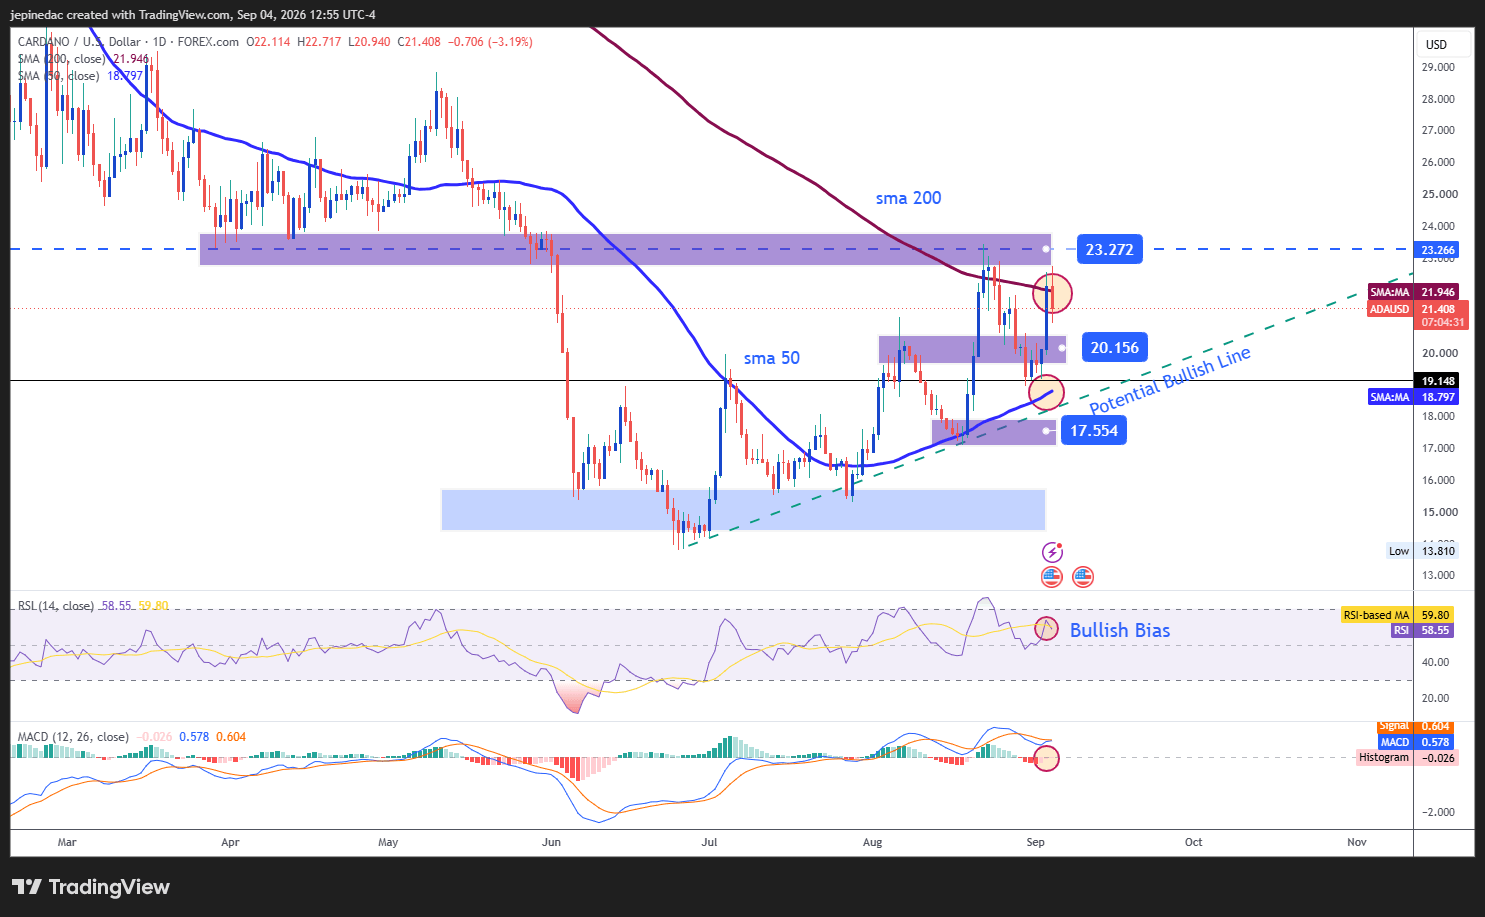
Cardano has been one of the strongest-performing cryptocurrencies of the week and one of the few assets able to maintain a relatively stable bullish profile. Recent price action continues to shape a potential bullish trendline that is becoming increasingly visible on the daily chart. As long as price remains supported above key levels, this structure could continue strengthening and become the most important technical pattern to monitor over the coming weeks.
Indicators:
- The RSI continues to display an upward slope above the 50 level, suggesting that buying momentum remains relevant in the short term. However, the MACD histogram remains very close to the neutral 0 line, a situation that still reflects balance within average moving average strength and suggests that indecision has not completely disappeared from the chart.
Key Levels:
- 23.27 – Major Resistance: A level that coincides with recent highs and the 200-period Simple Moving Average. Price action capable of breaking above this area could reinforce the emergence of a stronger bullish bias and support a more established uptrend.
- 20.15 – Nearby Barrier: A significant retracement zone that currently acts as the main equilibrium area on the chart. As long as price continues developing near this level, a lack of direction could remain relevant and even open the door to a broader sideways range that may threaten the consolidation of the bullish trend.
- 17.55 – Key Support: A level associated with previous lows and which also coincides with the 50-period moving average. A sustained move below this area could invalidate the current bullish structure and open the door to a more relevant bearish bias over the coming weeks.
Written by Julian Pineda, CFA, CMT – Market Analyst
Follow him on: @julianpineda25
Latest market news











Web Trader platform
Our sophisticated web-based platform is packed with features.
Open an account today
Experience award-winning platforms with fast and secure execution.
Economic calendar
Related articles

Bitcoin Forecast: BTC/USD Back to $80K Ahead of Warsh’s Jackson Hole Speech
After surging over $15,000 in the past 10 days alone, there is risk of a near-term pullback if Warsh says anything remotely hawkish at Jackson Hole - what are the levels to watch from here?


Bitcoin’s failed breakouts are becoming hard to ignore
Three failed breakout attempts and fading momentum have put Bitcoin bulls on notice. Another rejection could open the door lower just as attention swings back towards NVIDIA and the AI trade.


Bitcoin takes the baton as BTC/USD breaks higher
Bitcoin is heating up again, with BTC/USD breaking higher as momentum fades across the AI and semiconductor space.