


EUR/USD and GBP/USD Outlook: Bullish Patterns Form as Dollar Wavers
EUR/USD and GBP/USD form bullish setups as the US dollar loses momentum. Eurozone sentiment and US inflation data are key in the days ahead.
Written by
Matt Simpson
Market Analyst
With the US dollar stalling and macro data in focus, both EUR/USD and GBP/USD are showing signs of bullish continuation patterns. While the euro is supported by firmer sentiment data in the eurozone, traders are also watching for a potential shift in Fed expectations as US inflation data approaches. Futures positioning offers additional context, with net-long exposure favouring the current trend. Here’s the technical and macro-outlook for both pairs.
View related analysis:
- GBP/USD, EUR/GBP: COT Data Appears Favourable to British Pound Bulls
- USD/JPY Outlook: US Dollar and Japanese Yen Brace for PCE Inflation
- Australian CPI Data Supports RBA’s Cautious Approach on Rate Cuts
- WTI Crude Oil Outlook: Technicals Could Realign With Bearish Positioning
- Australian Dollar Outlook: Price Action Levels on AUD/USD, AUD/NZD
Macro Conditions Support Bullish Bias for EUR/USD and GBP/USD
Eurozone Data Could Delay ECB Cuts and Support the Euro
The European Central Bank (ECB) is expected to hold interest rates steady at its September meeting, though according to Reuters sources, policymakers are likely to revisit easing options at either the October or December meetings. As such, incoming economic data from both the eurozone and the United States will be crucial for EUR/USD traders.
First up is today’s release of the European Sentiment Indicator (ESI). While the headline index remains subdued and trapped within a narrow range, consumer price and selling price expectations have picked up. Notably, the 3-point month-on-month rise in selling price expectations was the sharpest increase in nearly three years, while inflation expectations climbed by 3.8 points—the fastest monthly rise in three months. Further strength in these components could delay expectations of an ECB rate cut and support the euro in the near term.
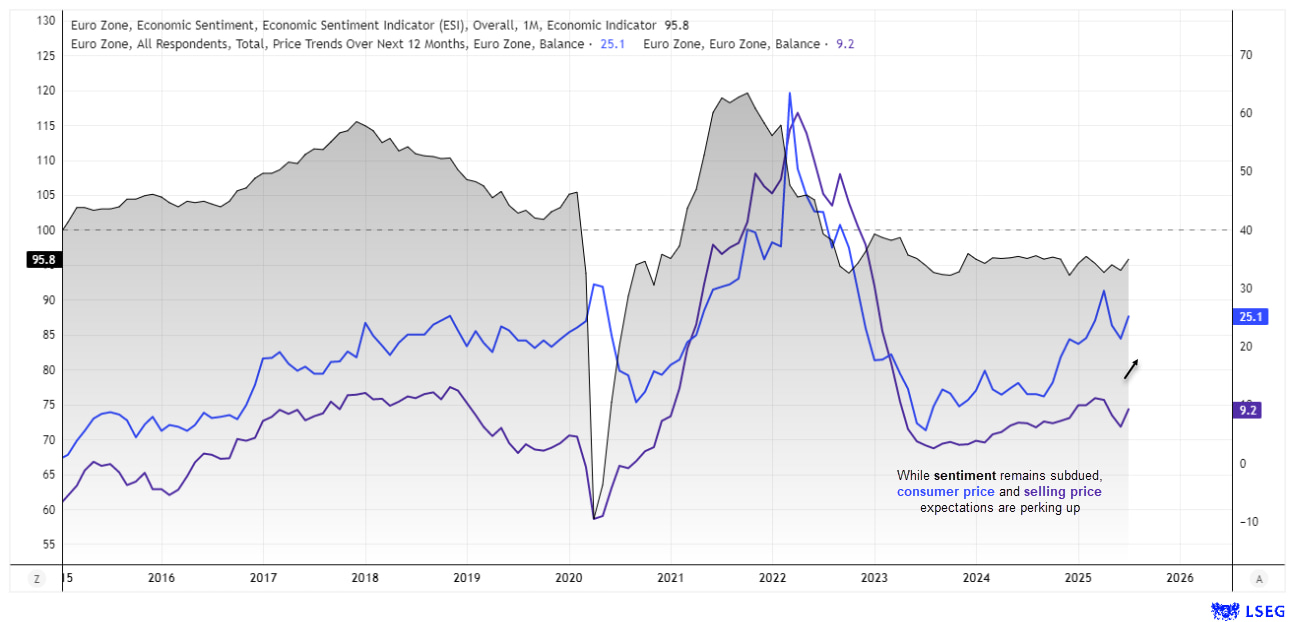
Chart analysis by Matt Simpson - data source: DG ECFIN – Directorate for Economic and Financial Affairs, LSEG
US PCE Inflation and GDP in Spotlight for USD Traders
On the US dollar side, attention turns to PCE inflation on Friday—a key release that could influence Fed rate expectations. A hotter-than-expected print may reduce the odds of Fed cuts and put downward pressure on EUR/USD. Meanwhile, US GDP data due later today is a revision of a backward-looking indicator and is therefore less likely to materially affect market pricing.
EUR/USD Futures Positioning: Weekly COT Analysis
The euro remains in a well-supported uptrend on the EUR/USD weekly chart, underpinned by increasingly bullish positioning in the futures market among large speculators and asset managers.
Gross-long positions in EUR/USD futures have been trending higher both before and during the latest leg of the rally, with further upside potential remaining before sentiment reaches an extreme. At the same time, gross-short positions remain relatively subdued—allowing net-long exposure to climb in tandem with price, without flashing a contrarian warning signal.
Given the structure forming on the weekly chart, the core bias is for a bullish continuation pattern to resolve with an upside breakout in EUR/USD. This outlook is reinforced by expectations of a weaker US dollar and continued strength in the euro as the year progresses.
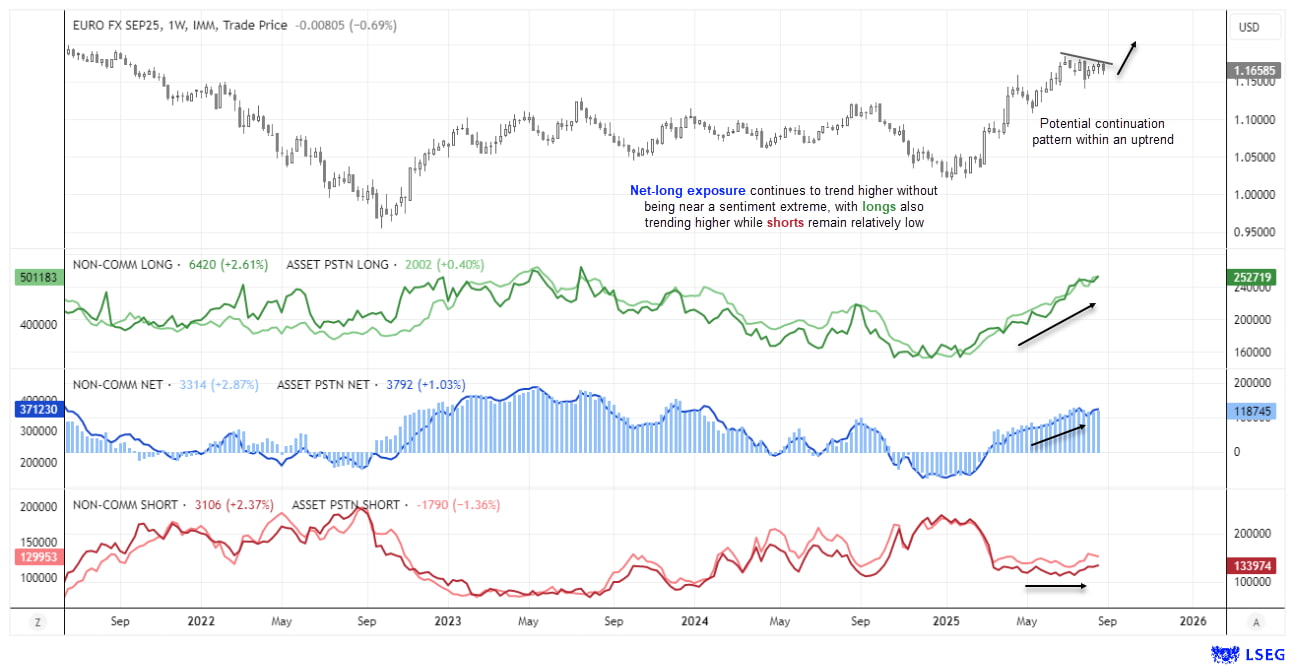
Chart analysis by Matt Simpson - data source: CME, LSEG
EUR/USD Technical Analysis: Daily Chart
An inverted head and shoulders (H&S) pattern is forming on the EUR/USD daily chart. If confirmed, it would project an upside target between the 2021 highs and the 1.20 handle. It’s also worth noting that inverted H&S patterns can act as continuation patterns during strong trends—such as the one currently seen on EUR/USD.
With prices holding above the 50-day EMA, there’s a possibility that the right shoulder (RS) is nearing completion. A bullish pin bar recently marked a false break below the 50-day EMA, hinting at a possible swing low. However, if prices retrace further, bulls may look for confirmation of support and a swing low forming above 1.15, near the monthly pivot point or the 1.1528 low.

Chart analysis by Matt Simpson - data source: TradingView EUR/USD
GBP/USD Technical Analysis: British Pound vs US Dollar
Another market displaying an inverted head and shoulders (H&S) pattern is GBP/USD, where the right shoulder (RS) recently found support at the monthly pivot point. However, a breakout above 1.3600 is required to confirm the pattern on the daily chart. That said, bulls may still look to capitalise on the anticipated upswing within the right shoulder structure.
A bullish outside day formed on Wednesday, marking a higher low. Like EUR/USD, GBP/USD also experienced a false break below the 50-day EMA, before closing back above it—adding to the bullish setup.
On the 4-hour chart, momentum turned sharply higher from the weekly S1 pivot, and price now trades above the weekly pivot. The weekly R1 lies just below 1.3600, making it a viable near-term upside target. A break above this level would confirm the inverted H&S pattern and signal the potential for a stronger bullish move.
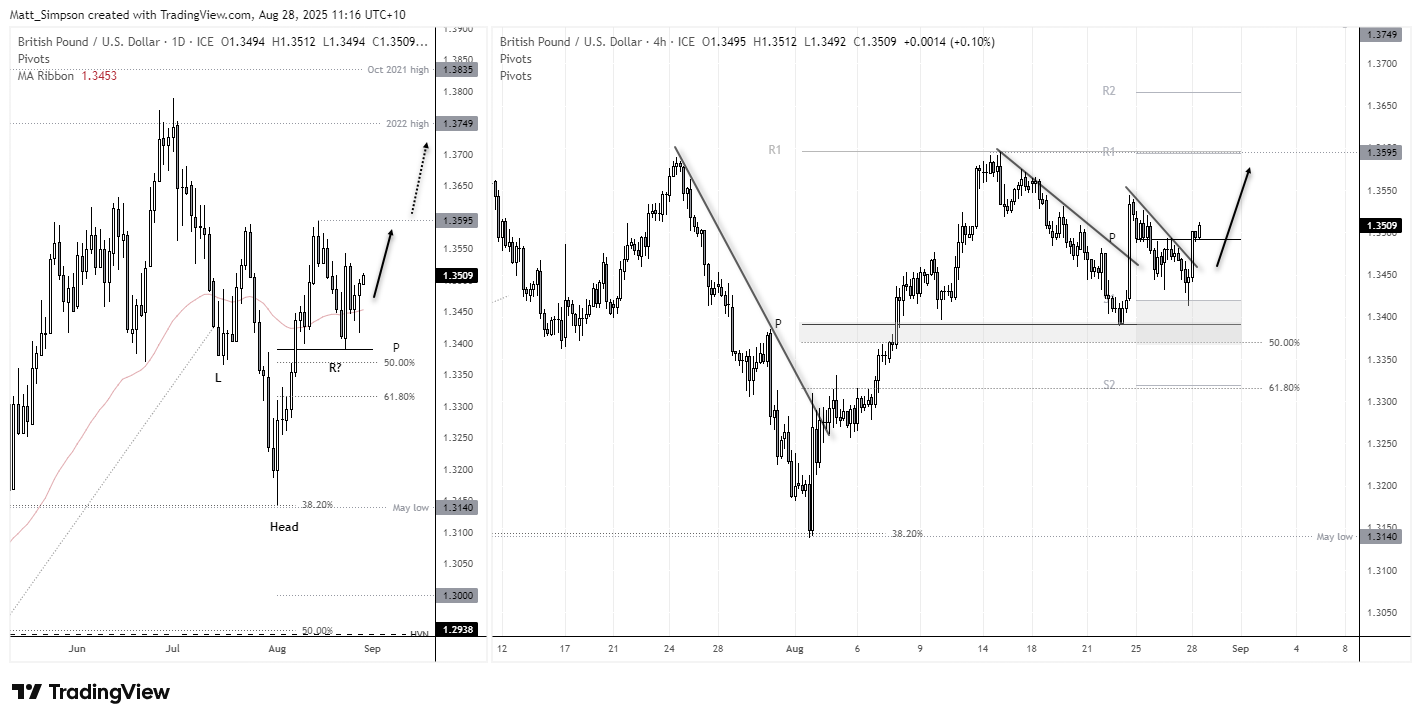
Chart analysis by Matt Simpson - data source: TradingView GBP/USD
Economic Events in Focus (AEST / GMT+10)
17:00 CHF GDP (Q2) (USD/CHF, EUR/CHF)
18:00 EUR M3 Money Supply (Jul), Loans to Non Financial Corporations (Jul), Private Sector Loans (Jul) (EUR/USD, EUR/GBP, DAX)
18:30 EUR Portuguese Business Confidence (Aug), Portuguese Consumer Confidence (Aug) (EUR/USD, EUR/GBP)
19:00 EUR Business and Consumer Survey (Aug), Business Climate (Aug), Consumer Confidence (Aug), Consumer Inflation Expectation (Aug), Selling Price Expectations (Aug), Services Sentiment (Aug), Industrial Sentiment (Aug) (EUR/USD, EUR/GBP, DAX)
21:30 EUR ECB Publishes Account of Monetary Policy Meeting (EUR/USD, EUR/GBP, DAX)
22:30 USD Jobless Claims, GDP (Q2) (S&P 500, Nasdaq 100, USD/JPY)
22:30 CAD Average Weekly Earnings (Jun), Current Account (Q2) (USD/CAD, CAD/JPY)
00:00 USD Pending Home Sales (Jul), Pending Home Sales Index (Jul) (S&P 500, Nasdaq 100, USD/JPY)
00:30 USD Natural Gas Storage (WTI Crude, Brent Crude, USD/CAD)
01:00 USD KC Fed Composite Index (Aug), KC Fed Manufacturing Index (Aug) (S&P 500, Nasdaq 100, USD/JPY)
View the full economic calendar
-- Written by Matt Simpson
Follow Matt on Twitter @cLeverEdge
How to trade with City Index
You can trade with City Index by following these four easy steps:
- Open an account, or log in if you’re already a customer
• Open an account in the UK
• Open an account in Australia
• Open an account in Singapore
- Search for the market you want to trade in our award-winning platform
- Choose your position and size, and your stop and limit levels
- Place the trade
Related tags:







Web Trader platform
Our sophisticated web-based platform is packed with features.
Open an account today
Experience award-winning platforms with fast and secure execution.
Economic calendar
Related articles

Euro Short-term Outlook: EUR/USD Pullback Nears Pivotal Uptrend Support 8 28 2026
Warsh's comments accelerated the EUR/USD selloff, raising the stakes as buyers look to stabilize the broader recovery.


Gold and S&P 500 analysis: What now after Warsh’s hawkish speech?
The dollar surged across the board after the Fed Chair Kevin Warsh surprised with a hawkish-leaning speech at the Jackson Hole summit. All the bearish dollar bets that had been accumulated since last Friday on the back of data weakness and bond market troubles had to be squared and that triggered a short squeeze rally for the dollar. Gold and silver dropped, as a result, as too did bitcoin, while US indices were giving back earlier gains.


EUR/USD forecast: All eyes on Warsh at Jackson Hole - Forex Friday
For much of this week, the EUR/USD has been edging lower with the US dollar regaining some ground after last week’s sell-off that was triggered, in part, by the bond market worries. Investors have been unwilling to bet further against the US dollar so far this week ahead of Kevin Warsh’s keynote speech at the Jackson Hole summit, due later today.