


EUR/USD, GBP/USD Outlook: RSI Hits 2020 Oversold Levels
EUR/USD, GBP/USD Outlook: The EUR/USD daily RSI has fallen to oversold levels last seen in 2020, raising the risk of a reversal across correlated currency pairs, including the US dollar and GBP/USD.
Written by
Razan Hilal
Market Analyst
The EUR/USD daily RSI has fallen to oversold levels last seen in 2020, raising the risk of a reversal across correlated currency pairs, including the US dollar and GBP/USD.
The US Dollar Index and major dollar pairs are testing new 2026 highs, putting pressure on the euro, which is trading near new 2026 lows, while the pound is approaching multi-month support. This move has been supported by US Treasury yields rising to levels last seen in 2002, resilient US GDP growth revised to 2.2%, and ongoing geopolitical risks in the Middle East.
However, momentum indicators across yields and currencies are beginning to show signs of exhaustion, raising the risk of a near-term pullback as we enter the fourth quarter of 2026.
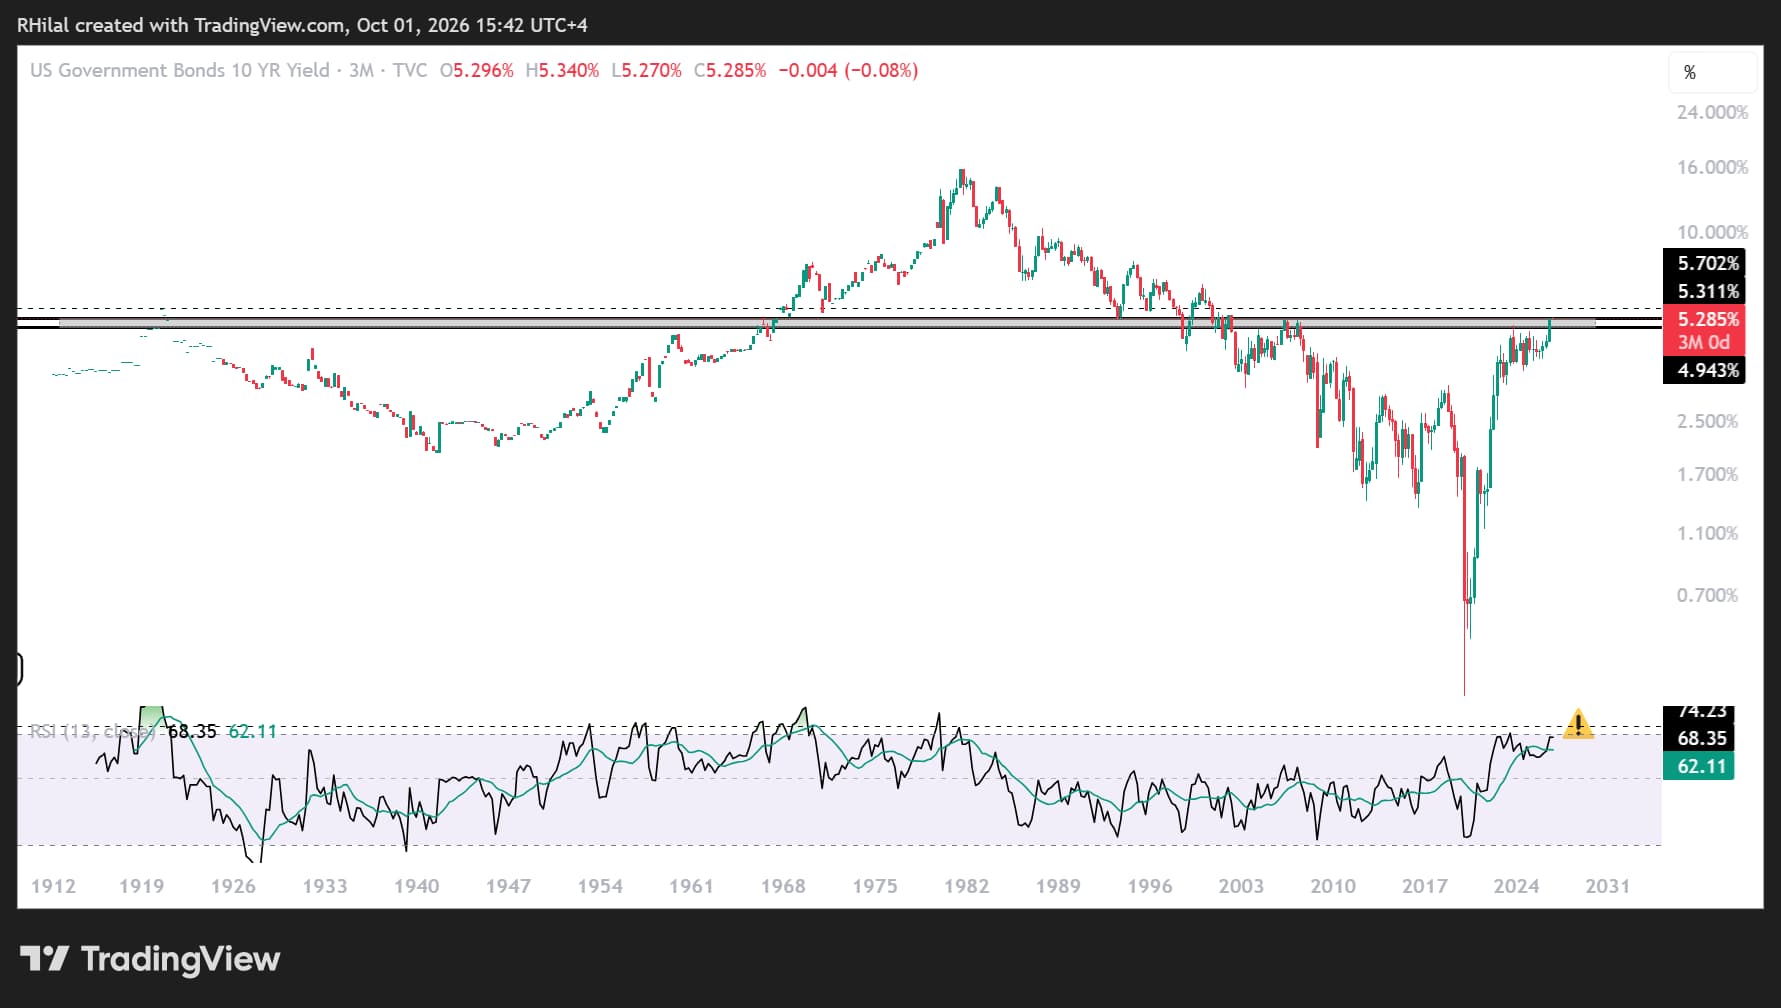
US 10-Year Treasury Yields: 3-Month Time Frame- Log Scale
Source: TradingView
US 10-year Treasury yields are testing highs last seen in 2002, near 5.3%, as well as a major historical barrier that has acted as both support and resistance since the 1920s.
A bearish RSI divergence between 2022 and 2026, combined with momentum reaching overbought levels last seen in 1980, suggests that a pullback in yields and dollar pairs may be approaching. Such a move could ease pressure on major currency pairs, including EUR/USD and GBP/USD.
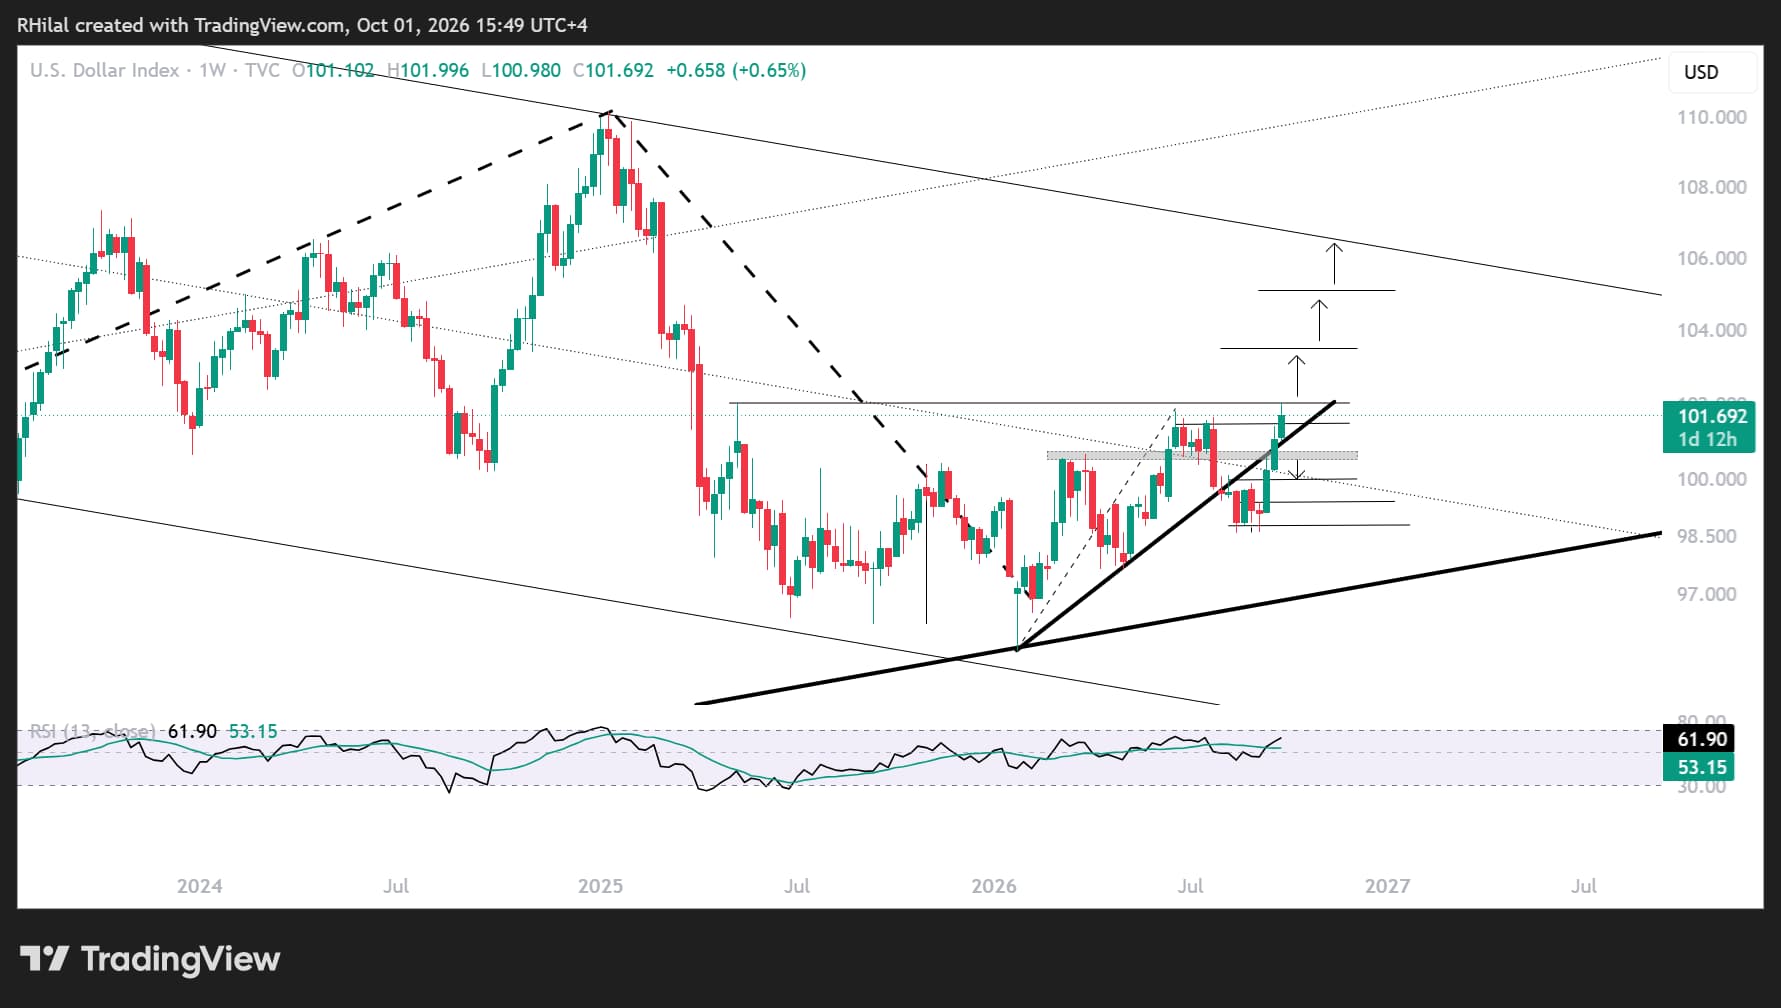
DXY Outlook: Weekly Time Frame - Log Scale
Source: TradingView
The DXY’s new 2026 high near 102 is facing clear resistance aligned with the 38.2% Fibonacci retracement of the 2025–2026 downtrend and the previous peak recorded in May 2025. Daily momentum is also approaching overbought levels last seen in 2025.
Current bias: Pullback risk
Bearish reversal scenario
A confirmed reversal would likely involve price falling back below the 2026 uptrend line connecting the sequence of higher lows, as well as below the 100.50–100.30 support barrier.
The key invalidation level for the bullish setup is the psychological 100 mark, which aligns with the mid-zone of the 2022–2026 channel. A break below this level could coincide with a longer-term reversal in Treasury yields and allow a stronger rebound in global currencies.
Bullish continuation scenario
A weekly close above 102 would expose 103.50, 105.00 and 107.00. These levels correspond to the 50% and 61.8% Fibonacci retracements of the 2025–2026 downtrend, although they could also represent areas of renewed pullback risk.
This scenario would likely be supported by continued tensions in the Middle East, renewed inflationary pressures, further Federal Reserve policy divergence and US Treasury yields moving above their recent extremes.
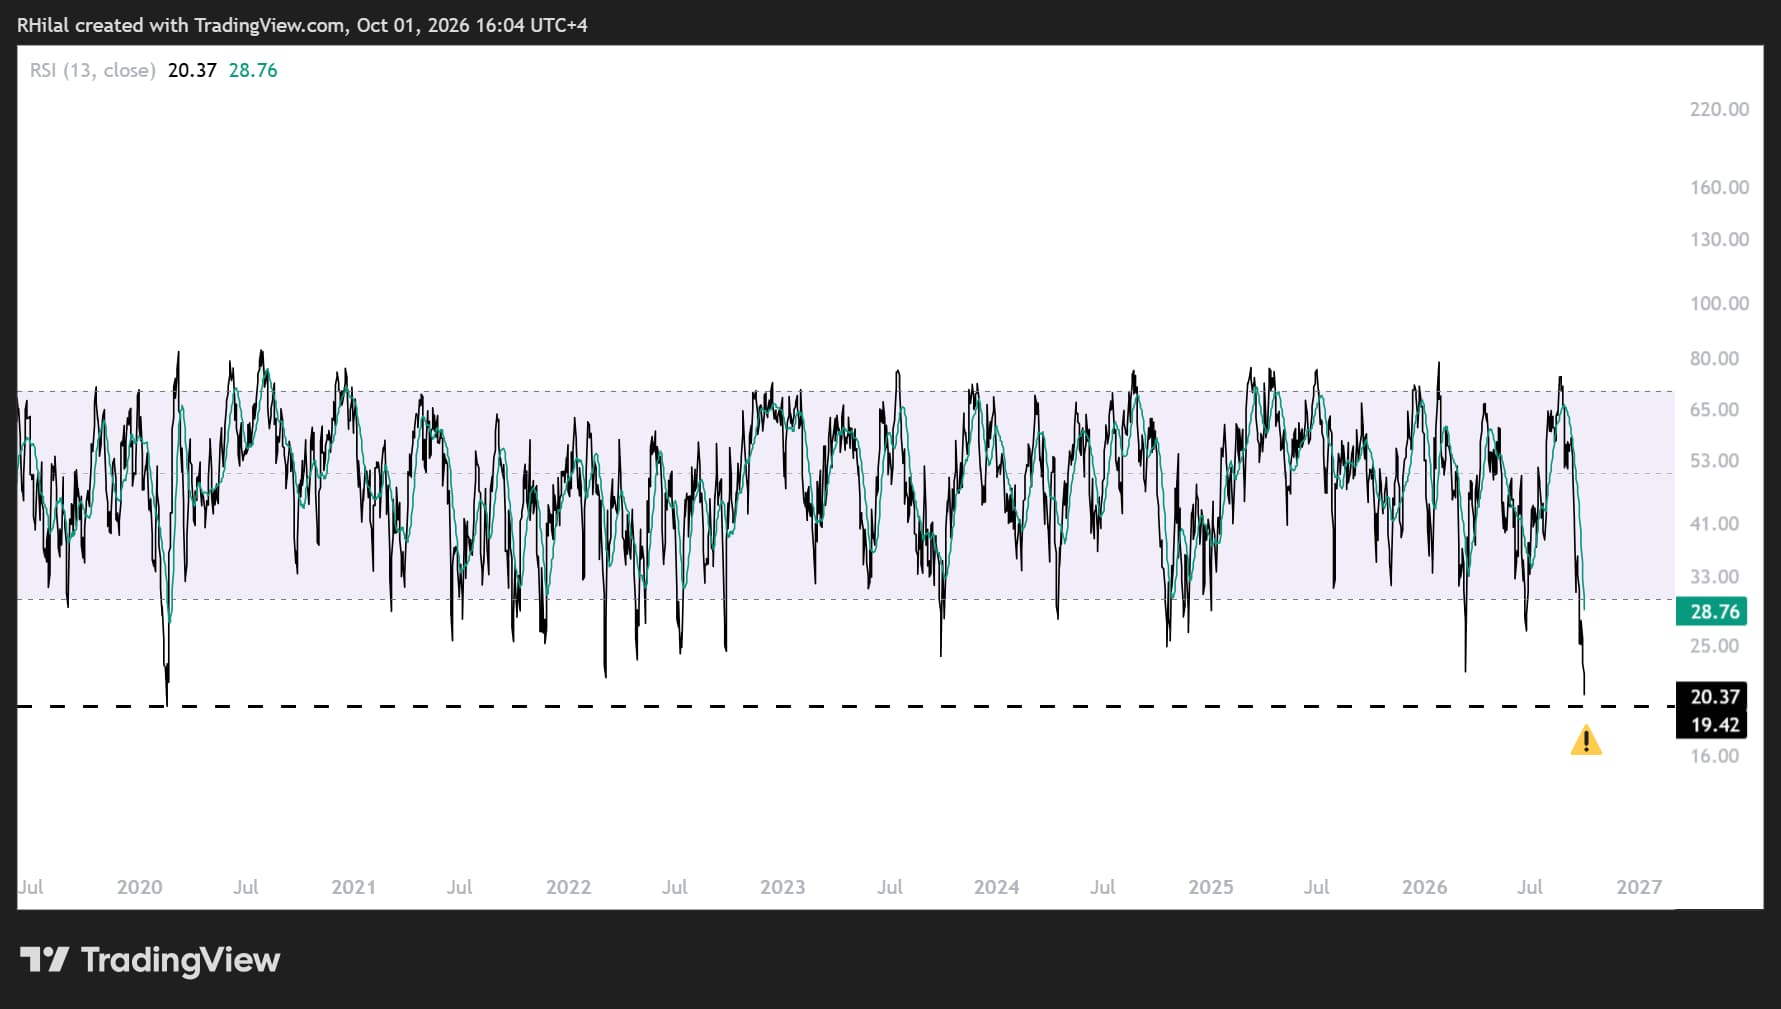
However, the EUR/USD daily RSI falling to oversold levels last seen in 2020 is signaling a potential reversal risk.
EUR/USD Daily RSI Outlook - Log Scale
Source: TradingView
Unlike the DXY and GBP/USD, EUR/USD momentum has become significantly stretched. The daily RSI is testing levels last seen in 2020, reflecting heightened reversal risk that could be linked to a potential reversal in bond yields and broader currency-market positioning.
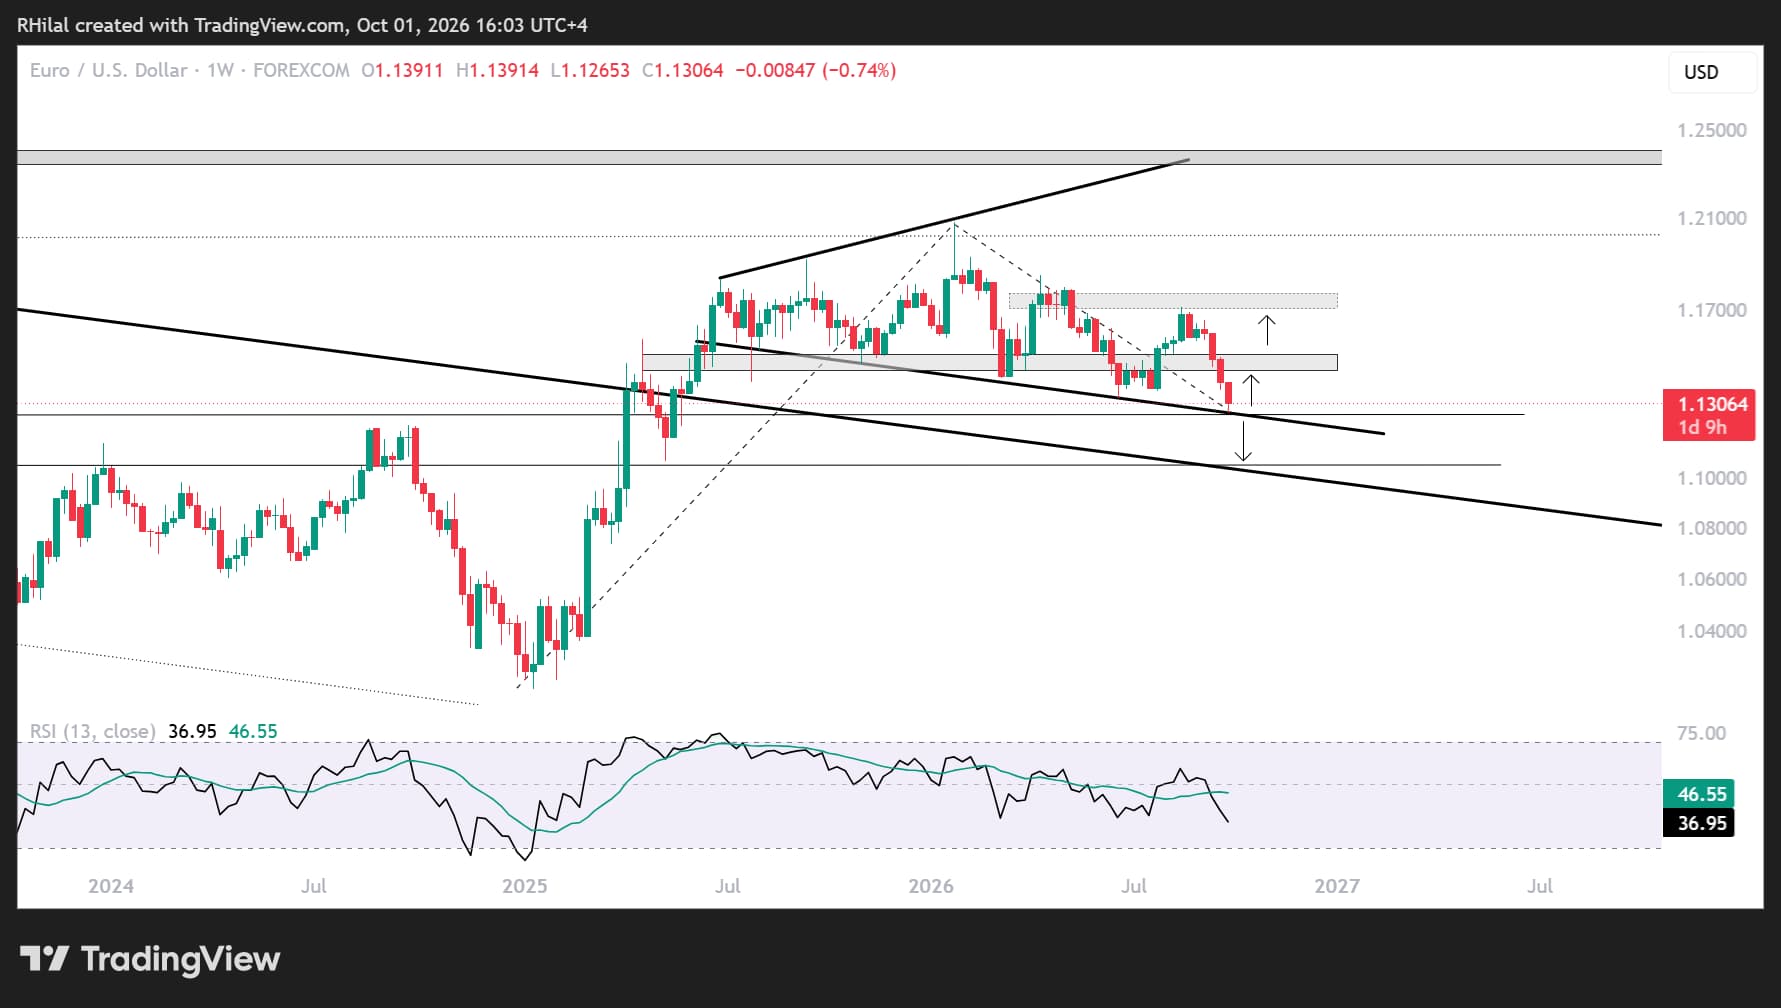
EUR/USD Price Outlook: Weekly Time Frame
Source: TradingView
On the weekly chart, EUR/USD is testing support from a respected downtrend line extending from April 2025, near 1.1250.
With the pair testing year-long support while momentum reaches six-year oversold levels, a potential rebound may be approaching.
Bullish scenario
A rebound above the 1.1450–1.1500 region would strengthen the case for a bullish recovery. A breakout above 1.1500 would expose the 2026 highs, followed by the 1.1700–1.1780 region.
These levels correspond with Fibonacci extension levels from the wave cycle between 2025 and 2026.
Bearish scenario
A breakdown below 1.1250, which represents the 38.2% Fibonacci retracement of the 2025–2026 advance, would expose the 1.1050 area.
This level represents the 50% retracement and aligns with the upper boundary of the previous 2008–2025 downtrend channel, potentially creating a major dip-buying opportunity.
GBP/USD Price Outlook: Weekly Time Frame - Log Scale
Source: TradingView
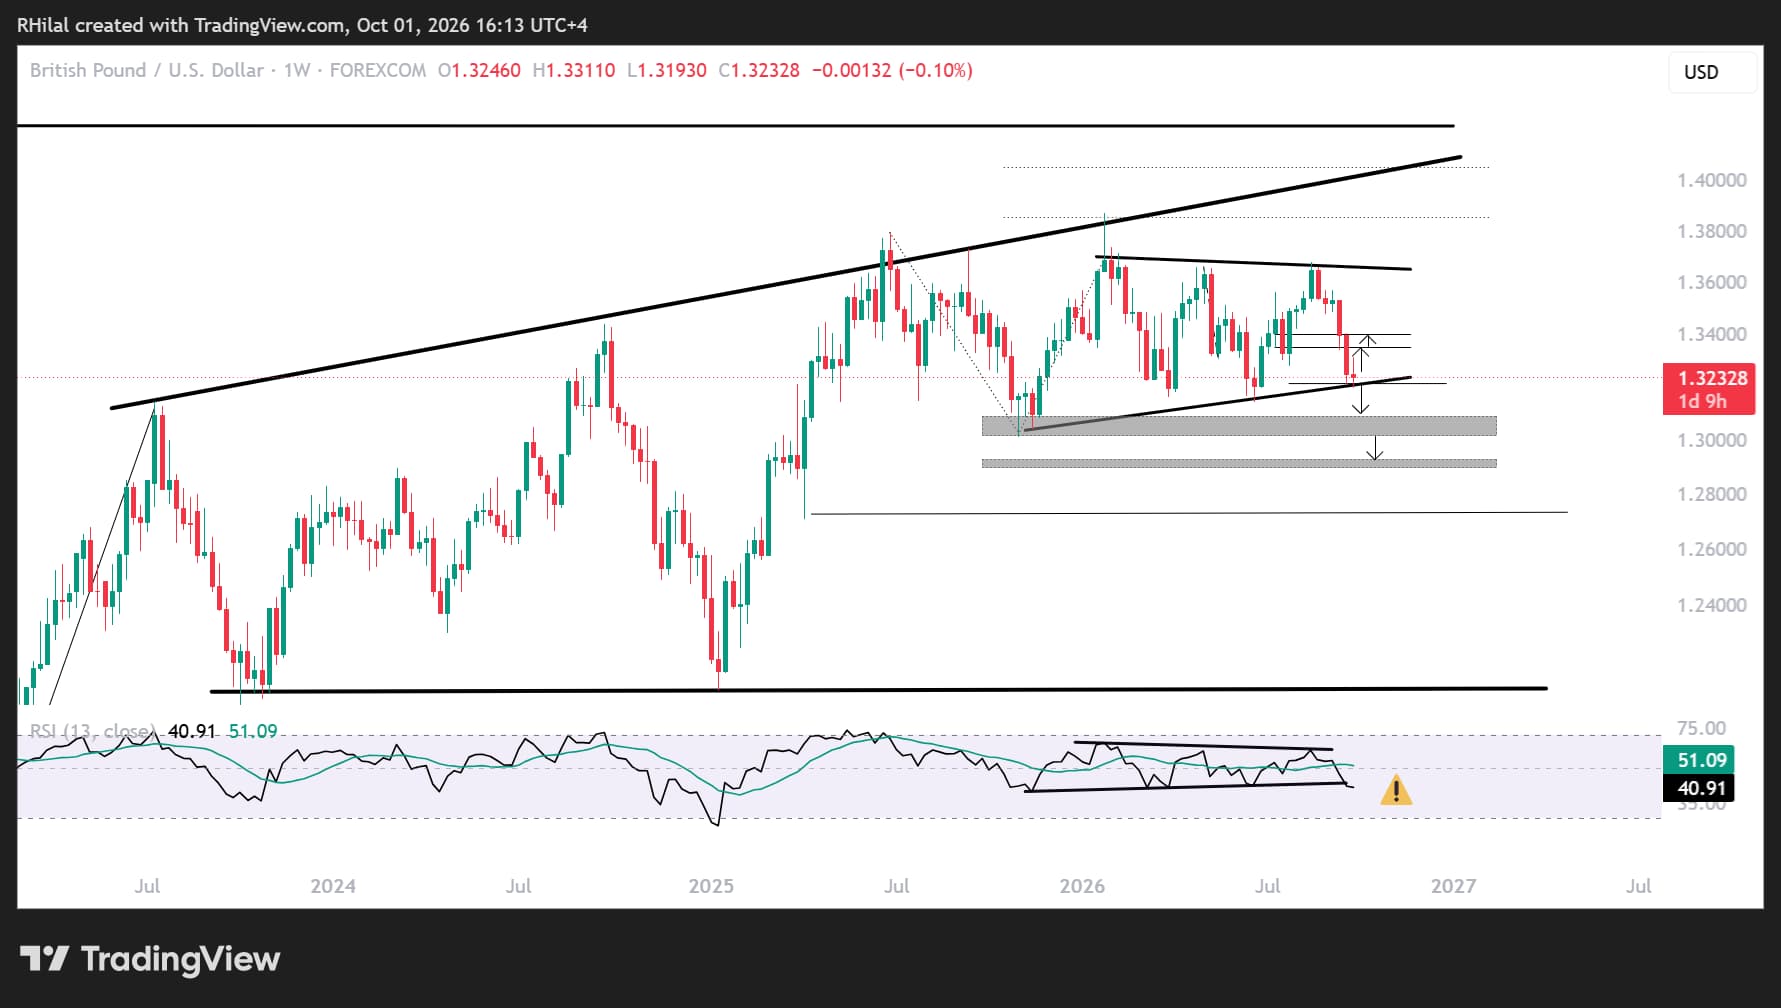
On the weekly chart, GBP/USD continues to hold above the lower boundary of its sideways consolidation range, which has been in place since November 2025. The pair remains above the 1.3190 area.
A breakdown below this consolidation range, followed by a break below the RSI consolidation pattern, would confirm a bearish scenario targeting 1.3090, 1.3020 and 1.2900.
These levels align with Fibonacci extension levels from the corrective cycle between June 2025, November 2025 and June 2026.
On the upside, a move back above 1.3340 and 1.3400 would shift the outlook towards the upper boundary of the consolidation range near 1.3600, before providing further confirmation of the longer-term trend.
Written by Razan Hilal, CMT
Follow on X: @Rh_waves
Related tags:
Latest market news











Web Trader platform
Our sophisticated web-based platform is packed with features.
Open an account today
Experience award-winning platforms with fast and secure execution.
Economic calendar
Related articles

EUR/USD forecast: All eyes on Warsh at Jackson Hole - Forex Friday
For much of this week, the EUR/USD has been edging lower with the US dollar regaining some ground after last week’s sell-off that was triggered, in part, by the bond market worries. Investors have been unwilling to bet further against the US dollar so far this week ahead of Kevin Warsh’s keynote speech at the Jackson Hole summit, due later today.


Bitcoin Forecast: BTC/USD Back to $80K Ahead of Warsh’s Jackson Hole Speech
After surging over $15,000 in the past 10 days alone, there is risk of a near-term pullback if Warsh says anything remotely hawkish at Jackson Hole - what are the levels to watch from here?


DAX, GBP/USD Forecast: Two trades to watch 2708
DAX rises as Nvidia boosts AI trade ahead of Jackson Hole. GBP/USD slips below 1.36 as Fed expectations shift.
