

Nikkei breakout accelerates as yen weakness returns
Nikkei has started October with a powerful breakout, helped by renewed yen weakness and strong upside momentum
Written by
David Scutt
Market Analyst
- Nikkei starts October with a powerful rally
- Yen weakness adds support to export-heavy Japanese equities
- Strong October starts have historically seen further gains
- Stretched momentum raises near-term pullback risk
Japan’s Nikkei has ripped higher to begin October, coinciding with renewed weakness in the yen, while a technical breakout has had significant follow-through.
Given the scale of the rally, I decided to go back through history and see whether there is such a thing as an October effect when it comes to the Nikkei.
No clear October effect
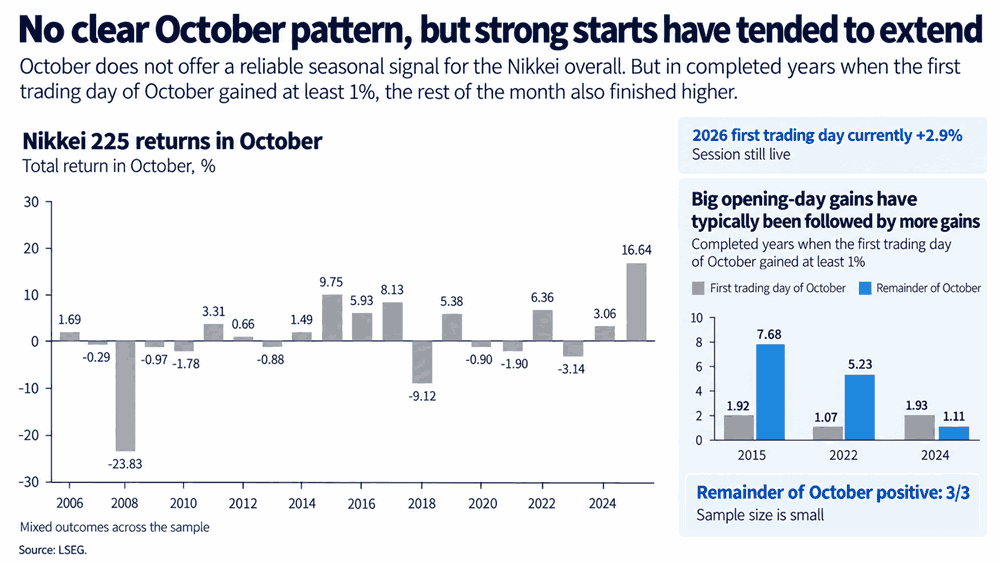
The results were very mixed, with plenty of large gains and losses scattered throughout the sample. Put simply, there is no significant pattern, let alone one reliable enough to hang your hat on.
However, it is interesting that when we have seen very strong starts to the month previously, albeit from a very limited sample size, it has often boded well for the index over the remainder of October.
Source: TradingView
In the three completed years where the Nikkei gained at least 1% on the first trading day of October, it went on to post further gains over the remainder of the month.
It’s not a signal that can be trusted, but with the index up so strongly, it’s certainly an interesting historical footnote to consider.
Other forces are helping the move
Beyond potentially spurious seasonality exercises, there are a few other things going on today that may help explain what we’re seeing.
For a start, October 1 marks the beginning of the second half of Japan’s fiscal year. We’ve also seen the yen weaken rapidly, which is undoubtedly helping the export-heavy index. Such has been the abruptness of the unwind in prior yen strength, it almost comes across like the coordination between Japan’s Finance Minister Katayama and US Treasury Secretary Scott “The House” Bessent to support the yen may have expired come September 30.
There was some data out earlier today with the release of the Bank of Japan’s Tankan survey, but there was nothing in it that screamed buy Japanese equities, especially to the scale of the move we’re seeing.
However, one look at the technical picture may provide the strongest clue of all.
Bulls punch through key technical levels
Source: TradingView
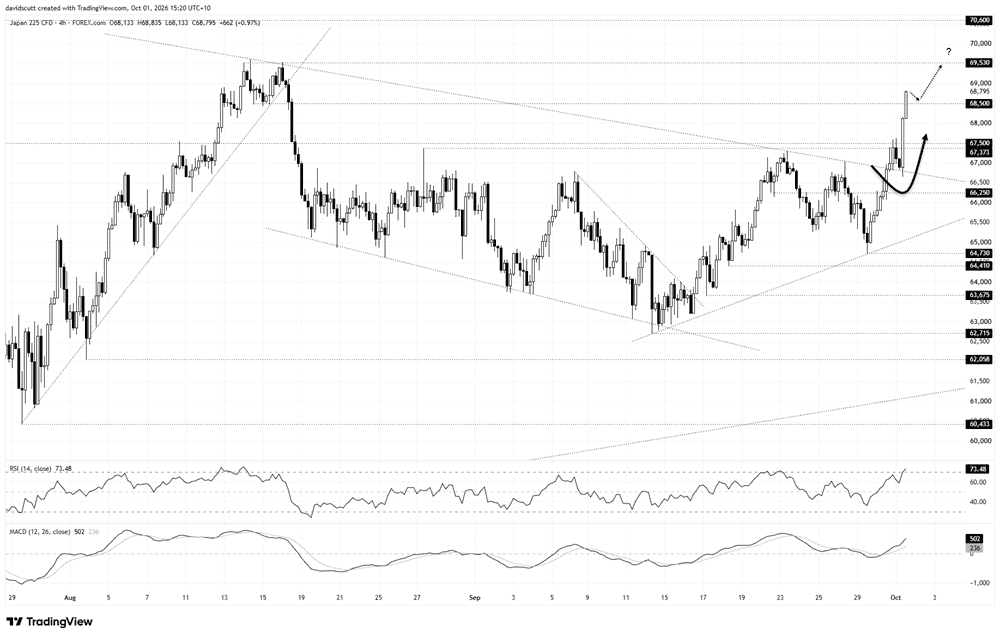
Having bounced from 64,730, the index went on a remarkable run of eight consecutive four-hourly candle gains, breaking through important downtrend resistance that had been in place from the high set earlier this year along the way.
The price then pulled back and retested that former downtrend resistance from above before going like a rocket, smashing through a resistance zone comprising 67,373, the high set on August 27, along with 67,500, which had capped the index for periods earlier this year.
The price has since reclaimed 68,500, which acted as support for a period back in August. That now becomes the immediate focal point underneath where the index trades, with 69,530 the level to watch overhead, coinciding with where the index stalled on three separate occasions in August.
If we were to see a clean break of that level, bulls may set their eyes on a retest of the psychologically important 70,000 level, and then beyond that, 70,600, which acted as support and resistance for periods back in June.
The message from the oscillators is bullish. RSI (14) continues to trend higher, indicating upside strength is building, although it has now reached overbought territory at 74. MACD is providing a complementary signal, having staged a bullish crossover and now accelerating further away from the signal line in positive territory.
Pullback risk is starting to build
While that favours long setups over shorts, there is an elevated risk of some form of pullback in the short term. Looking back through the four-hourly data, there have been 18 previous episodes where RSI (14) and MACD were both at least as elevated as they are now. Two-thirds saw the index trading lower 16 hours later, while the average move 32 hours later was around -0.8%. Two-thirds were also lower after 48 hours.
That is nowhere near reliable enough to call a top, but it does suggest the risk of a near-term shakeout is higher than usual following such an aggressive run.
For now, the broader technical picture remains bullish, but after a move of this scale, the risk-reward for chasing at current levels is becoming less attractive.
Latest market news











Web Trader platform
Our sophisticated web-based platform is packed with features.
Open an account today
Experience award-winning platforms with fast and secure execution.
Economic calendar
Related articles

Gold and S&P 500 analysis: What now after Warsh’s hawkish speech?
The dollar surged across the board after the Fed Chair Kevin Warsh surprised with a hawkish-leaning speech at the Jackson Hole summit. All the bearish dollar bets that had been accumulated since last Friday on the back of data weakness and bond market troubles had to be squared and that triggered a short squeeze rally for the dollar. Gold and silver dropped, as a result, as too did bitcoin, while US indices were giving back earlier gains.


EUR/USD forecast: All eyes on Warsh at Jackson Hole - Forex Friday
For much of this week, the EUR/USD has been edging lower with the US dollar regaining some ground after last week’s sell-off that was triggered, in part, by the bond market worries. Investors have been unwilling to bet further against the US dollar so far this week ahead of Kevin Warsh’s keynote speech at the Jackson Hole summit, due later today.

Bitcoin Forecast: BTC/USD Back to $80K Ahead of Warsh’s Jackson Hole Speech
After surging over $15,000 in the past 10 days alone, there is risk of a near-term pullback if Warsh says anything remotely hawkish at Jackson Hole - what are the levels to watch from here?
