


EURUSD Analysis Euro Starts the Week Showing Weakness
Following the strong recovery of the euro against the US dollar last week, slight indecision has reemerged on the EUR/USD chart. This is reflected in early week trading fluctuations, which now show a price decline of around -0.2%, indicating modest short-term strength for the dollar.
Written by
Julian Pineda
Market Analyst
Following the strong recovery of the euro against the US dollar last week, slight indecision has reemerged on the EUR/USD chart. This is reflected in early week trading fluctuations, which now show a price decline of around -0.2%, indicating modest short-term strength for the dollar. For now, this shift is paving the way for a neutral scenario following the recent bullish pressure. This pause may be tied to the lingering threat of higher interest rates in the United States and a potential rebound for the greenback after its recent depreciation. If these factors persist, consolidation could become the dominant theme in the coming sessions.

Is the FED Still Relevant?
Last week was crucial for the US monetary policy outlook. The Federal Reserve announcement featured comments that remain focused on the central bank's 2.00% inflation target, an objective yet to be achieved and heavily emphasized during the meeting. However, statements from FED Chair Kevin Warsh failed to confirm an overly aggressive stance for the coming months. Markets, anticipating more decisive signals, triggered a pronounced drop in dollar demand during those sessions.
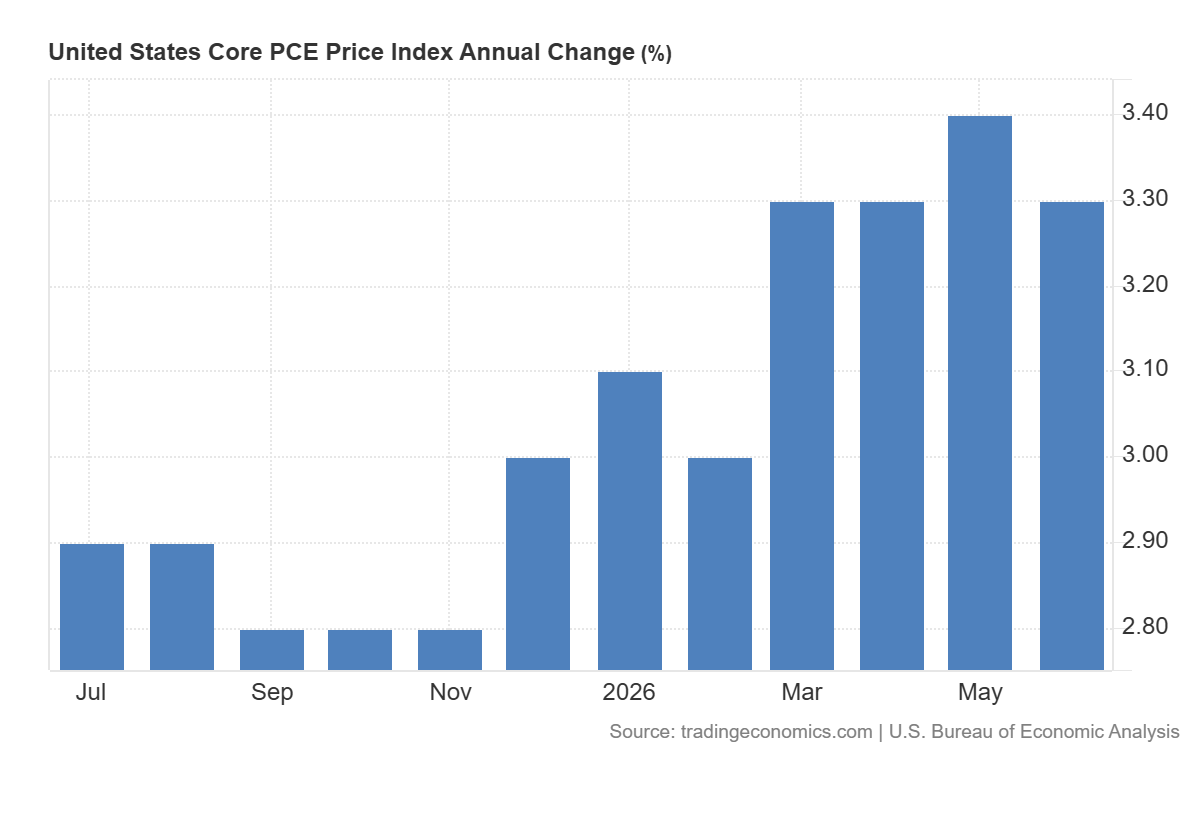
The context now looks slightly different following the central bank announcements. A couple of sessions ago, the core PCE Price Index for June was released. This is the official inflation gauge tracking price changes for consumed goods and services while excluding volatile items like food and energy. The June data showed the index settling around 3.3%. Although slightly below the year's peak of 3.4%, it has yet to show a significant enough decline to establish a clear downward trend in overall inflation. To some extent, this highlights lingering inflationary pressures still embedded in the economy.
Source: TradingEconomics
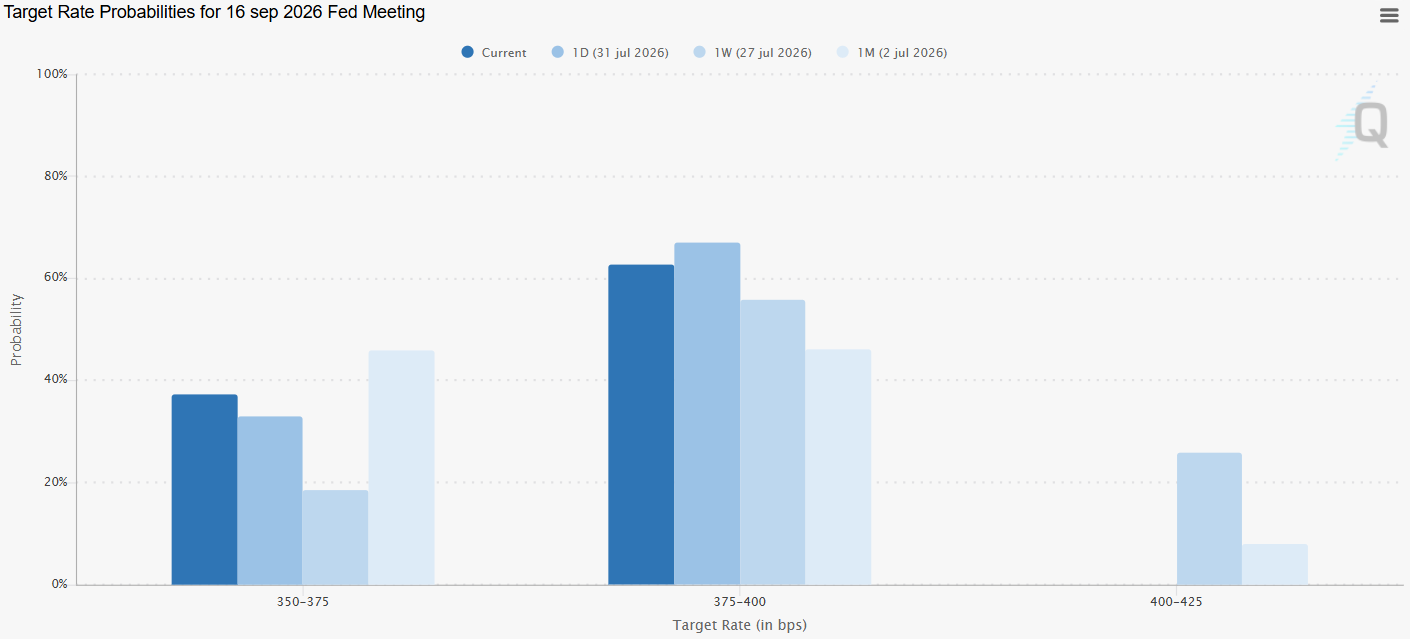
This data release likely played a key role in shaping expectations for the Federal Reserve September decision. A week ago, the probability according to CMEGROUP of a potential rate hike on September 16 to a new benchmark zone of 4.00% in the United States stood at around 55%. Today, following the inflation data, that probability has climbed to nearly 62%. This underscores that the market may still be pricing in a possible rate increase due to persistent inflationary pressures expected to linger in the US economy over the coming months.
Source: CMEGROUP
Taking all this into account, the prospect of the US central bank potentially raising interest rates in September could be helping the US dollar hold its ground in the short term. This is particularly noticeable after last week's loss of momentum, which allowed the euro to steadily regain ground. If the probability matrix for the FED continues to highlight a potential rate hike next month, dollar-denominated investments will likely remain attractive. This is because the US interest rate remains higher than Europe's, making it harder for the euro to resume its recovery easily and reinforcing a more solid phase of consolidation in the EUR/USD.
EUR/USD Technical Outlook
Source: StoneX, Tradingview
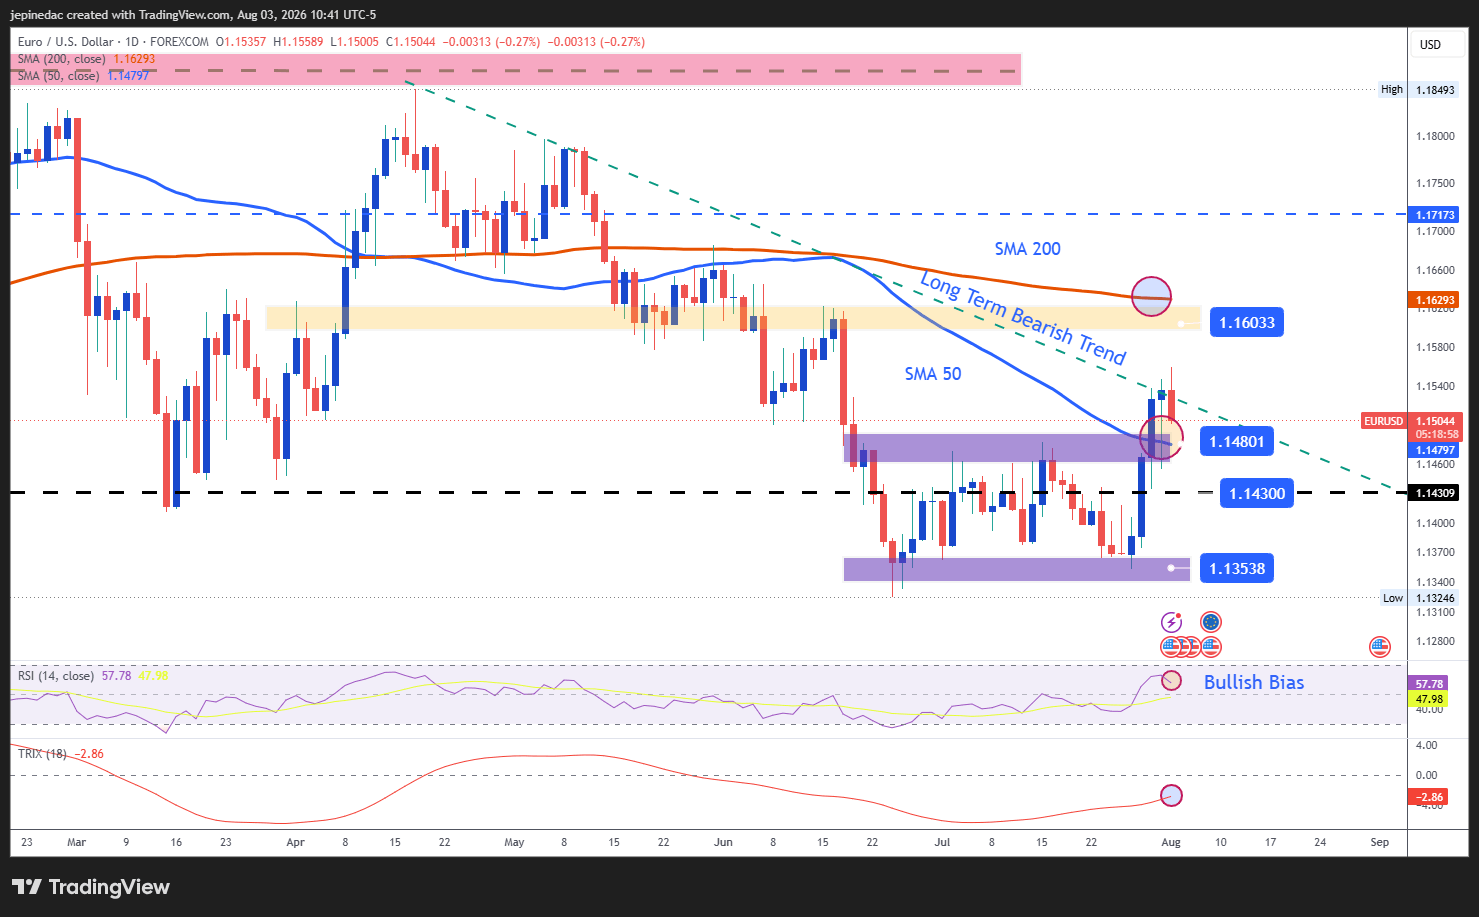
- Long-term trendline holds firm: For several months, average fluctuations in the EUR/USD have been defined by a long-term bearish trendline, which remains the most critical technical structure to watch. Despite the recent price recovery, buying pressure has not been strong enough to break through this line in the short term. Until a more robust bullish momentum emerges, this pattern will remain the primary technical driver for upcoming sessions.
- RSI: Currently, the RSI is consistently fluctuating above the 50 level, indicating that bullish momentum has dominated over the last 14 sessions. However, the indicator's curve has started to flatten. Over time, this could signal fading buying momentum, pointing to increased market indecision in the near term.
- TRIX: The TRIX also remains below the neutral 0 line, confirming that bearish pressure in the exponential moving averages is still relevant. If it fails to cross the neutral threshold, the broader chart will likely remain weighed down by the bearish bias that has dominated recent months.
Key Levels:
- 1.16033 (Key Resistance): This previous high acts as the most important bullish barrier above the long-term bearish trendline dominating the chart. A sustained price move and close above this level could trigger a breakout of the current technical structure, opening the door for a new short-term bullish trendline to take shape.
- 1.14801 (Nearby Barrier): This level corresponds to a significant retracement zone and coincides with the 50-period simple moving average. Failure of the price to consistently move away from this area could highlight ongoing indecision, potentially leading to the formation of a prolonged sideways channel.
- 1.14300 (Ultimate Support): This level aligns with a retracement zone from previous weeks and stands as the most crucial psychological support. A drop back below this threshold could revive a dormant bearish bias and reinforce the extension of the long-term bearish trendline as the dominant structure.
Written by Julian Pineda, CFA, CMT – Market Analyst
Follow him on: @julianpineda25
Latest market news










Web Trader platform
Our sophisticated web-based platform is packed with features.
Open an account today
Experience award-winning platforms with fast and secure execution.
Economic calendar
Related articles

Nasdaq 100 Forecast: NDX slips ahead of Fed Chair Warsh’s speech
U.S. stocks are edging lower on Friday, giving back some of yesterday's gains after Nvidia's strong outlook revived the tech trade. The focus has now shifted firmly to Fed Chair Kevin Warsh's Jackson Hole speech, with investors looking for more clarity on the outlook for interest rates.


EUR/USD forecast: All eyes on Warsh at Jackson Hole - Forex Friday
For much of this week, the EUR/USD has been edging lower with the US dollar regaining some ground after last week’s sell-off that was triggered, in part, by the bond market worries. Investors have been unwilling to bet further against the US dollar so far this week ahead of Kevin Warsh’s keynote speech at the Jackson Hole summit, due later today.


S&P 500 Forecast: SPX after Nvidia revives confidence in the AI trade
U.S. stocks are heading higher on Thursday, with technology leading the move after Nvidia's stronger-than-expected outlook revived confidence in the AI trade.