


Fed, DXY, EUR/USD, AUD/USD, Gold, Bitcoin Weekly Technical Outlook 6 15 2026
Sr. Technical Strategist Michael Boutros highlights the levels that matter on the USD Majors, commodities, and equity indices charts this week.
Written by
Michael Boutros
Sr. Technical Strategist
Weekly Technical Trade Levels on USD Majors, Commodities & Stocks
- Technical trade setups we are tracking into the start of the week on the USD Majors, commodities, bitcoin, and equity indices.
- Next Weekly Strategy Webinar: Monday, June 22 at 8:30am ET
- Review the latest Video Updates or Stream Live on my YouTube playlist
In this webinar we take an in-depth look at the technical trade levels for the US Dollar (DXY), Euro (EUR/USD), British Pound (GBP/USD), Australian Dollar (AUD/USD), Canadian Dollar (USD/CAD), Japanese Yen (USD/JPY), Swiss Franc (USD/CHF), Gold (XAU/USD), Crude Oil (WTI), and Bitcoin (BTC/USD), and S&P 500 (SPX500), Nasdaq (NDX), and Dow Jones (DJI). These are the levels that matter on the technical charts into the weekly open. The assets are chaptered on the recording for your convenience.
US Dollar Index Price Chart – USD 240min
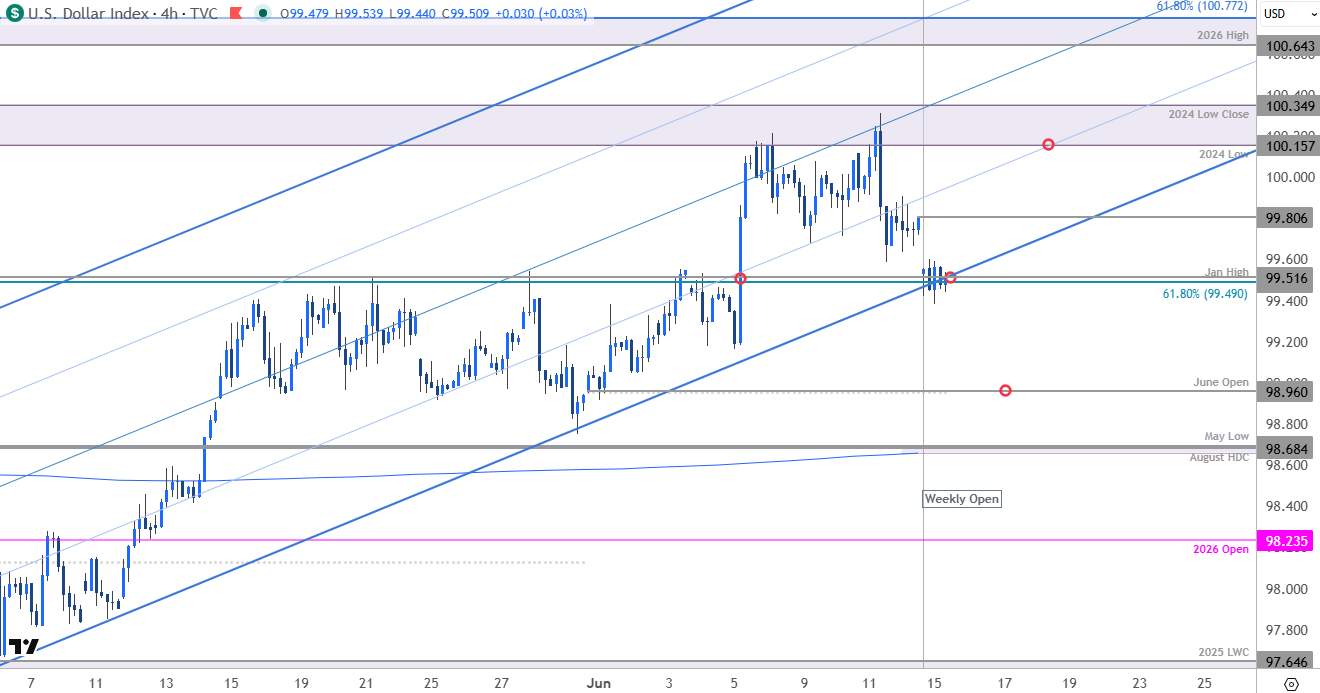
Chart Prepared by Michael Boutros, Sr. Technical Strategist; DXY on TradingView
Notes: The U.S. Dollar Index is trading at confluent uptrend support into the start of the week around 99.49/52- a region defined by the 61.8% retracement of the late-March decline and the January swing high. Note that the lower parallel converges on this level today and a break / close below would threaten the multi-week uptrend.
Monthly open support rests at 98.96 and is backed by the 200-day moving average, the August high-day close (HDC), and the May low at 98.66/68. Losses below this threshold would suggest a more significant high is in place and a larger trend reversal is underway.
Initial resistance is eyed at the Friday close near 99.81 with the 2024 low / low close at 100.15/35 still critical. Look for a larger reaction there IF reached again with a breach / close above needed to fuel the next major leg of the USD advance.
Bottom line: The U.S. Dollar marked an outside-day reversal off resistance last week with the pullback now testing uptrend support. From a trading standpoint, rallies would need to be limited to 99.80 IF the index is heading lower here with a with a close below 99.49 to fuel the next phase of the correction.
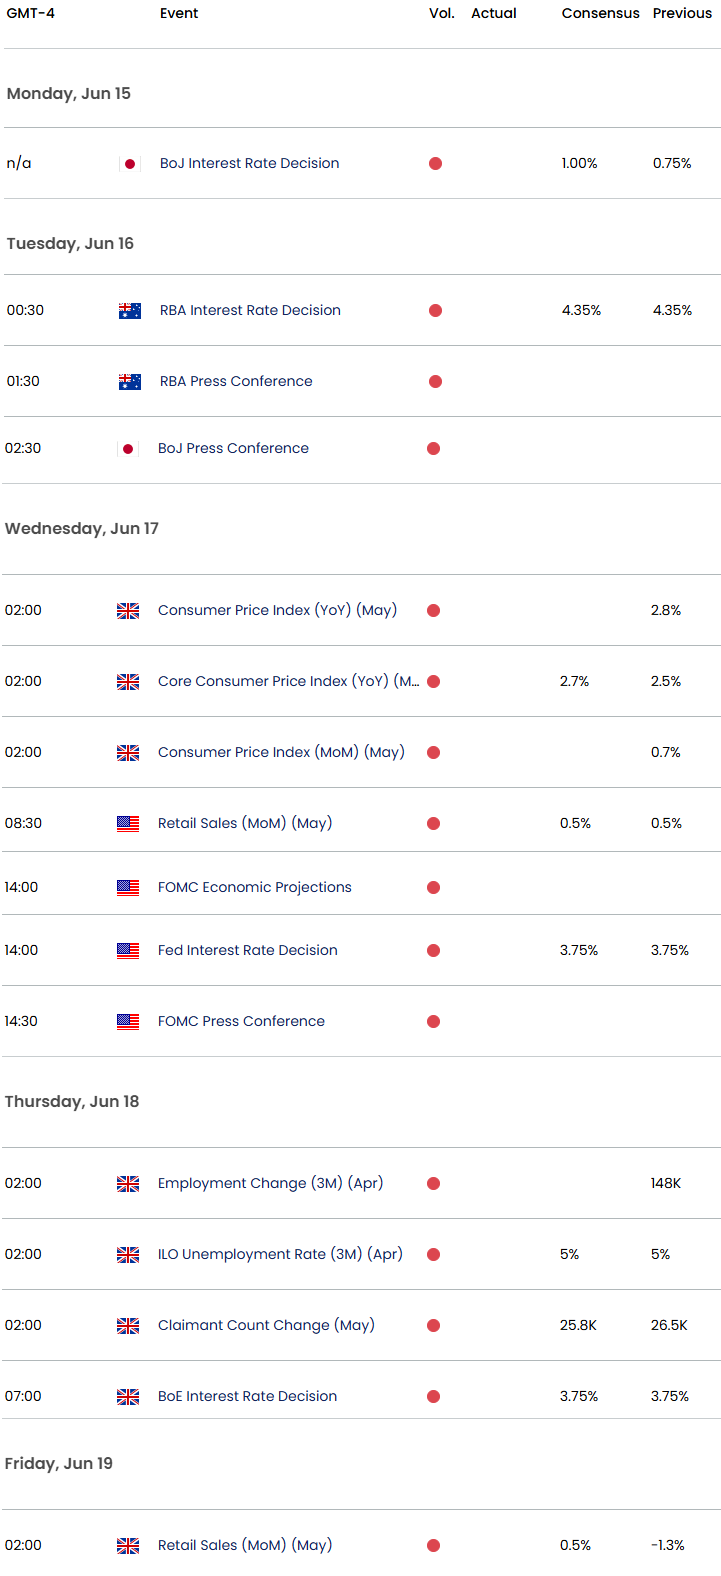
Keep in mind the FOMC rate decision is on tap Wednesday and while the central bank is widely expected to leave rates unchanged, traders will be closely eyeing the updated Summary of Economic Projections on growth, employment, and most notably inflation. Newly minted Fed Chair Kevin Warsh will hold his first presser this week and investors will be looking to gauge the chairman’s outlook on monetary policy on the heels of the Iran deal announcement. As of now, Fed Fund Futures are pricing 54% chance the central bank will need to hike rats by at least 25 basis points this year. Stay nimble into the release and watch the weekly close here for guidance. Review my latest US Dollar Weekly Forecast for a closer look at the longer-term DXY technical trade levels.
Euro Price Chart – EUR/USD Daily
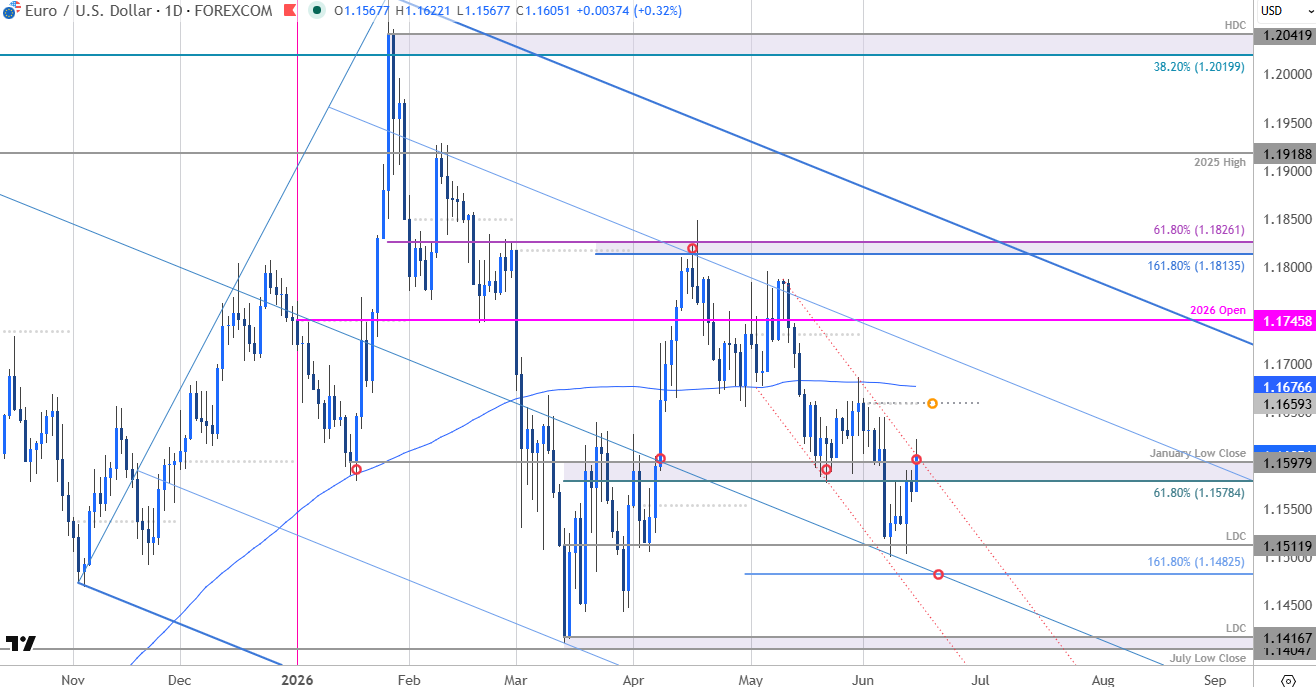
Chart Prepared by Michael Boutros, Sr. Technical Strategist; EUR/USD on TradingView
Notes: Is Euro breaking out? In a similar scenario to the DXY, EUR/USD is trading into pivotal resistance today at the 1.1578/98- a region defined by the 61.8% retracement of the March rally, the May low, and the January low close. Note that basic channel resistance converges on this zone today and the focus is possible inflection here in the days ahead.
A topside breach / close above this threshold exposes the monthly open and the 200-day moving average near 1.1659/76 backed by the yearly open at 1.1746. Initial support rests with the yearly low-day close at 1.1512 with a break / close below 1.1483 needed to mark resumption of the broader downtrend towards the yearly lows.
Bottom line: Euro is attempting to break out of a multi-month downtrend. From a trading standpoint, a good zone to reduce portions of long-exposure / raise protective stops- losses would need to be limited to the Sunday open (1.1567) IF price is heading higher on this stretch with a close above the 200DMA needed to suggest a more significant low is in place and a larger reversal is underway.
Economic Calendar – Key Data Releases
Economic Calendar - latest economic developments and upcoming event risk.
--- Written by Michael Boutros, Senior Technical Strategist
Follow Michael on X @MBForex







Web Trader platform
Our sophisticated web-based platform is packed with features.
Open an account today
Experience award-winning platforms with fast and secure execution.
Economic calendar
Related articles

Euro Short-term Outlook: EUR/USD Pullback Nears Pivotal Uptrend Support 8 28 2026
Warsh's comments accelerated the EUR/USD selloff, raising the stakes as buyers look to stabilize the broader recovery.

Nasdaq 100 Forecast: NDX slips ahead of Fed Chair Warsh’s speech
U.S. stocks are edging lower on Friday, giving back some of yesterday's gains after Nvidia's strong outlook revived the tech trade. The focus has now shifted firmly to Fed Chair Kevin Warsh's Jackson Hole speech, with investors looking for more clarity on the outlook for interest rates.


EUR/USD forecast: All eyes on Warsh at Jackson Hole - Forex Friday
For much of this week, the EUR/USD has been edging lower with the US dollar regaining some ground after last week’s sell-off that was triggered, in part, by the bond market worries. Investors have been unwilling to bet further against the US dollar so far this week ahead of Kevin Warsh’s keynote speech at the Jackson Hole summit, due later today.
