


Gold Price Forecast: XAU/USD Drops 12%—Yearly Support Now Critical 6 6 2026
Gold is testing pivotal support, and the next move could determine whether this selloff stabilizes—or turns into something much bigger.
Written by
Michael Boutros
Sr. Technical Strategist
Gold Technical Forecast: XAU/USD Weekly Trade Levels
- Gold has fallen nearly 12% from the April highs after breaking a major support zone.
- XAU/USD is now testing yearly open support at a critical technical inflection point.
- A break below support would threaten resumption of the broader correction and expose deeper downside targets.
- Risk remains tilted to the downside while below the monthly open.
- Strong NFPs shift Fed outlook- traders look to key inflation data on tap next week.
- Resistance 4493-5540 (key), 4894, 5025– Support 4319 (key), ~4195, 4074-4112
Gold remains under heavy pressure after breaking below a key support zone that held for more than five weeks, with XAU/USD now testing the yearly open at a pivotal technical level. The decline has accelerated in the wake of stronger U.S. economic data and shifting rate expectations, bringing price into a region that could determine whether the selloff extends or begins to stabilize. The focus early in the week is on how gold responds to this support zone as downside momentum collides with a major technical inflection point. Battle lines drawn on the XAU/USD weekly technical chart.
Review my latest Weekly Strategy Webinar for an in-depth breakdown of this gold setup and more. Join live on Monday’s at 8:30am EST.
Gold Price Chart – XAU/USD Weekly
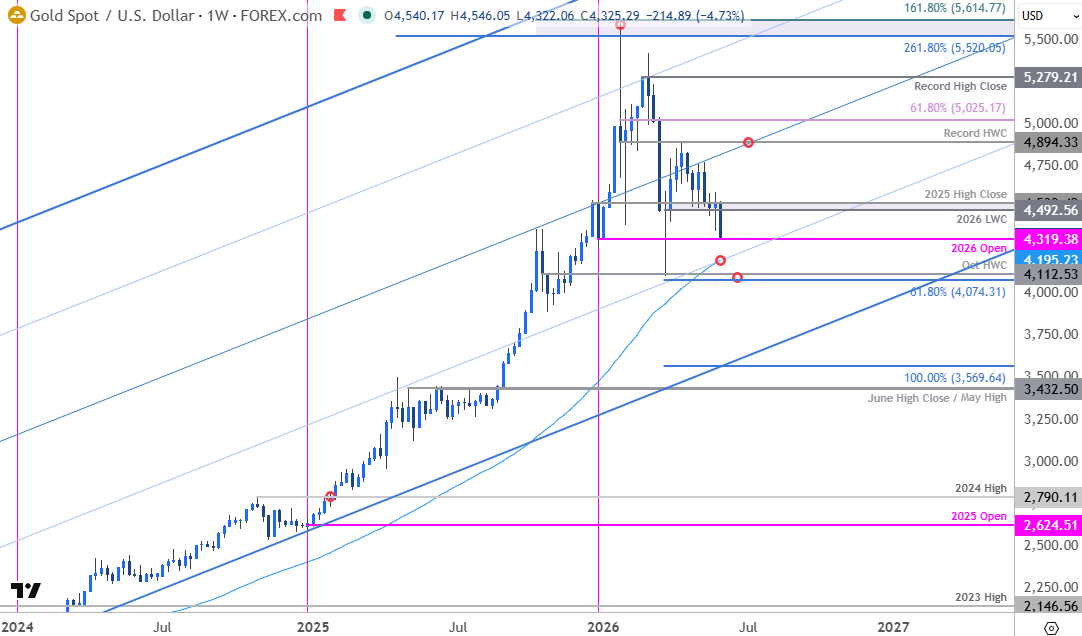
Chart Prepared by Michael Boutros, Sr. Technical Strategist; XAU/USD on TradingView
Technical Outlook: In last month’s Gold Technical Forecast we noted that XAU/USD was, “sitting at technical support at multi-week range lows, and the risk remains for price inflection off this zone. From a trading standpoint, the focus remains on a breakout of the monthly range for guidance with the bears vulnerable while above 4493.” Price held support for more than five weeks before finally breaking lower on the heels of a stronger-than-expected Non-Farm Payroll report on Friday. A decline of more than 4.7% last week takes gold into yearly open support at 4319- look for a reaction off this mark early in the week ahead.
A break / close below this level exposes subsequent support objectives at the 52-week moving average (currently near ~4195), which converges on the 25% parallel next week, and 4074-4112- a region defined by the 61.8% extension of the January decline, the yearly swing low, and the October high-week close. Both levels of interest for possible downside exhaustion / price inflection IF reached.
Resistance now stands with former support at 4493-4540- a region defined by the 2026 low-week close, the 2025 high close and the objective monthly open. A breach / weekly close above this pivot zone would be needed to suggest a more significant near-term low is in place with subsequent resistance eyed at the record high-week close (HWC) at 4894 and the 61.58% retracement of the January decline at 5025.
Bottom line: Gold testing yearly open support here with weekly momentum reaching the lowest levels since October 2023 when the yearly low was tested and defended. From a trading standpoint, rallies should be limited to 4533 IF price is heading lower on this stretch with a close below 4319 needed to fuel the next major leg of the decline.
Rate expectations were repriced aggressively in the wake of the NFP release, with Fed funds futures now implying nearly a 73% probability of at least one 25-basis-point rate hike before year-end. The focus now shifts to next week's May CPI report, where another firm inflation reading could reinforce the recent hawkish shift in market pricing. With the inflation side of the dual mandate likely to dictate the next move for newly minted Fed Chair Kevin Warsh, gold remains vulnerable so long as energy prices stay elevated. Stay nimble into next week’s CPI release and watch the weekly closes here for guidance. Review my latest Gold Short-term Outlook for a closer look at the near-term XAU/USD technical trade levels.
Key US Economic Data Releases
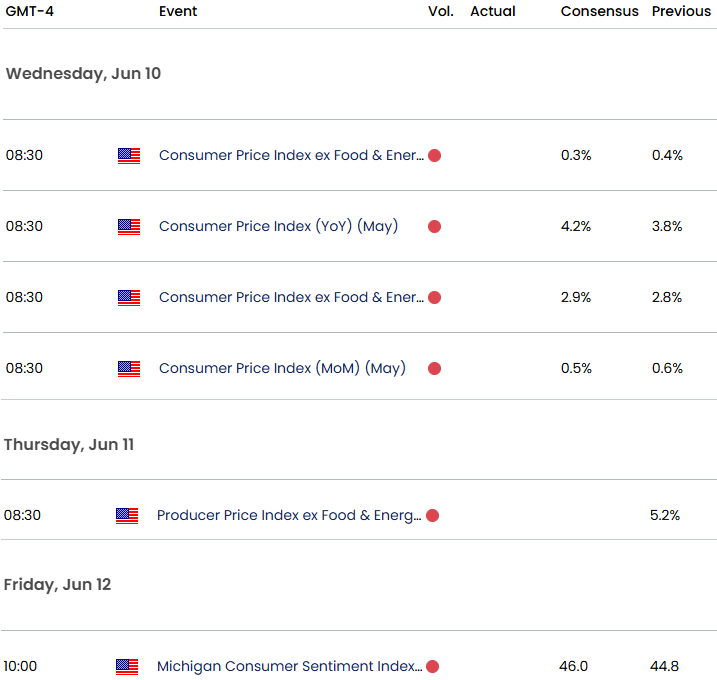
Economic Calendar - latest economic developments and upcoming event risk.
Active Weekly Technical Charts
- US Dollar Index (DXY)
- Japanese Yen (USD/JPY)
- Swiss Franc (USD/CHF)
- Euro (EUR/USD)
- Bitcoin (BTC/USD)
- British Pound (GBP/USD)
- Australian Dollar (AUD/USD)
- Canadian Dollar (USD/CAD)
--- Written by Michael Boutros, Senior Technical Strategist
Follow Michael on X @MBForex







Web Trader platform
Our sophisticated web-based platform is packed with features.
Open an account today
Experience award-winning platforms with fast and secure execution.
Economic calendar
Related articles

Canadian Dollar Forecast: USD/CAD Weekly Reversal Puts Yearly Uptrend Back in Focus 8 29 2026
USD/CAD has staged its strongest weekly advance since June, shifting the focus to whether a more durable low is finally taking shape.

USD/JPY weekly outlook: Payrolls may challenge the Fed’s hawkish reset
USD/JPY has finally woken from its slumber. Payrolls now loom as the key test of whether the latest hawkish repricing sticks or sinks.


Euro Short-term Outlook: EUR/USD Pullback Nears Pivotal Uptrend Support 8 28 2026
Warsh's comments accelerated the EUR/USD selloff, raising the stakes as buyers look to stabilize the broader recovery.