


GBPUSD, Silver Price Outlook: Will the Pound Hold 1.33 Support and Silver 65?
GBPUSD tests the critical 1.33 support zone while silver challenges 65 amid shifting geopolitical sentiment. Explore key support levels, resistance zones, and bullish and bearish scenarios.
Written by
Razan Hilal
Market Analyst
The British pound is testing the critical 1.33 support zone, while silver continues to challenge the 65 level after markets experienced a brief risk-on reaction following news of a completed peace deal. However, uncertainty persists, and the key technical scenarios remain unchanged.
Recent market moves have reflected the usual contrast between optimistic claims from Trump and uncertainty surrounding Iran's response. This backdrop triggered a momentum rebound across several assets that had recently experienced sharp declines, including precious metals, currencies, and US equity indices.
The broader narrative remains tied to questions surrounding Iran's nuclear capabilities, one of the core drivers behind the conflict. Market sentiment is leaning towards an optimistic hold, with crude oil's decline back below its multi-month consolidation range, trading near $82 per barrel.
I discussed the importance of this crude oil pattern and its implications for the broader market narrative during my daily MENA Market Call webinar.
Register here to follow the analysis live: register.gotowebinar.com/#register/1712903232130037596
Markets Continue to Face Key Resistance Levels
The ongoing trigger-and-response dynamic between the United States and Iran is also reflected on the charts, where attempted reversals continue to encounter significant resistance levels.
- Gold rebounded more than 200 points from the 4,020 low before pulling back from resistance near 4,240.
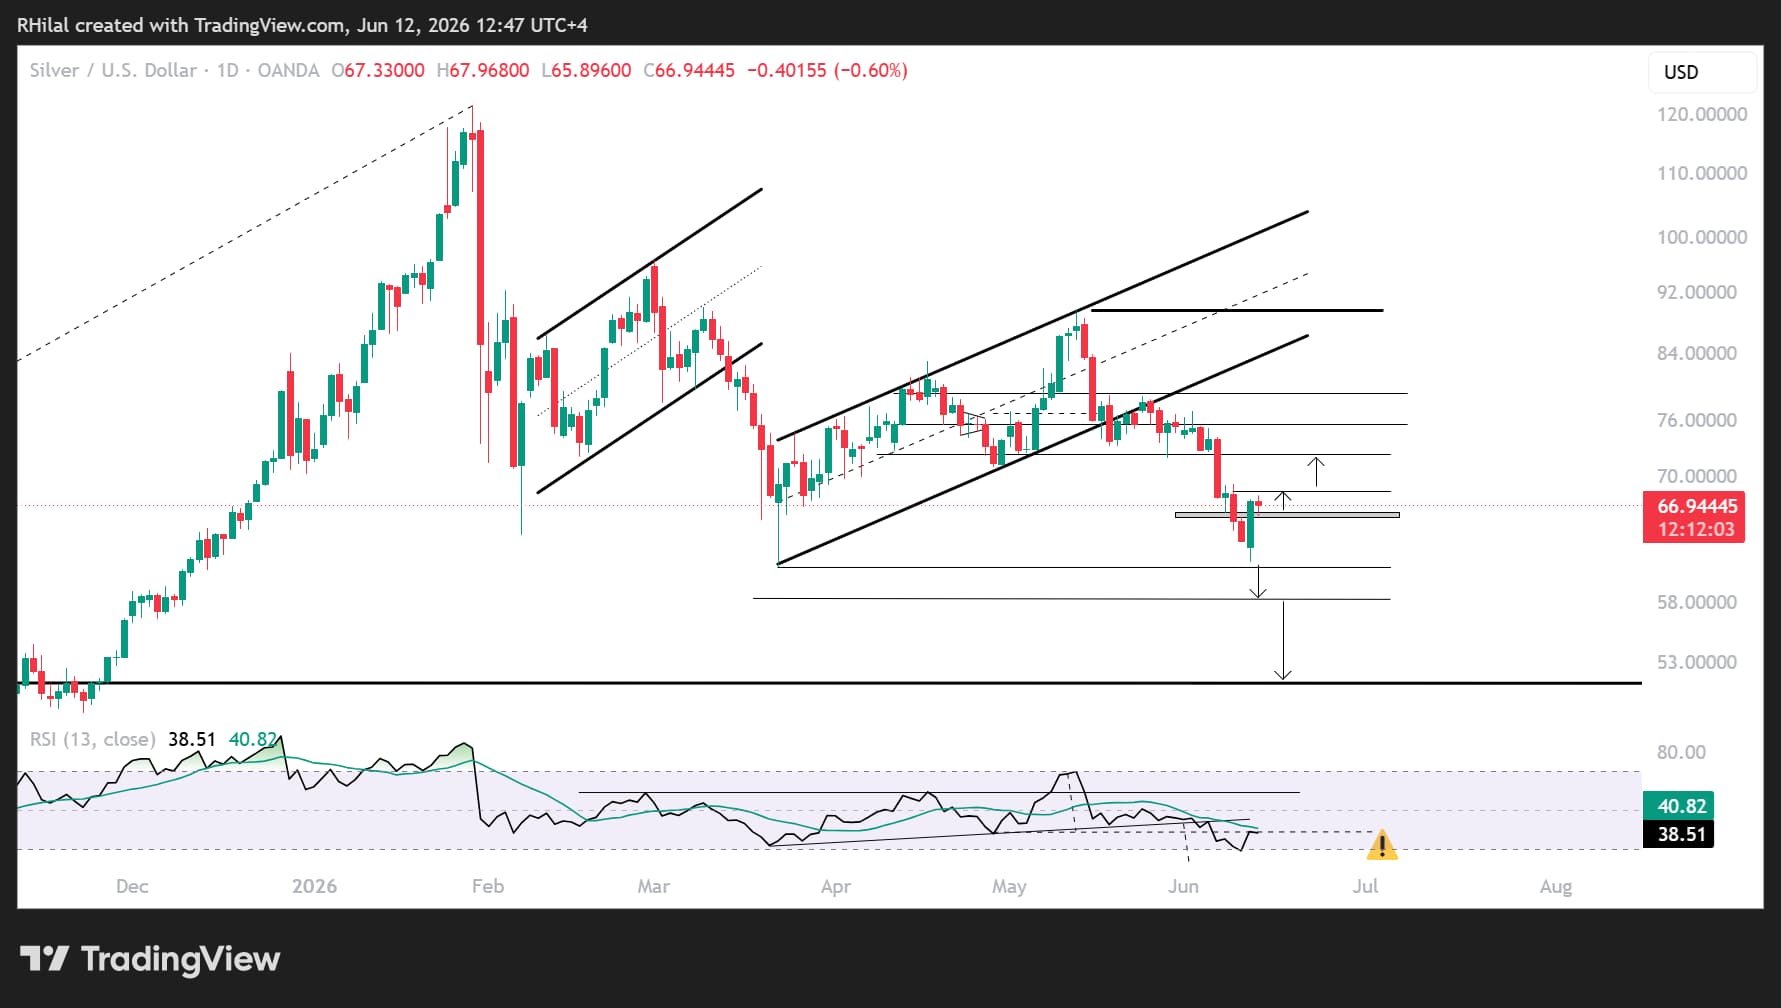
- Silver rebounded more than 600 points from the 61.40 low before stalling near the 68 resistance zone.
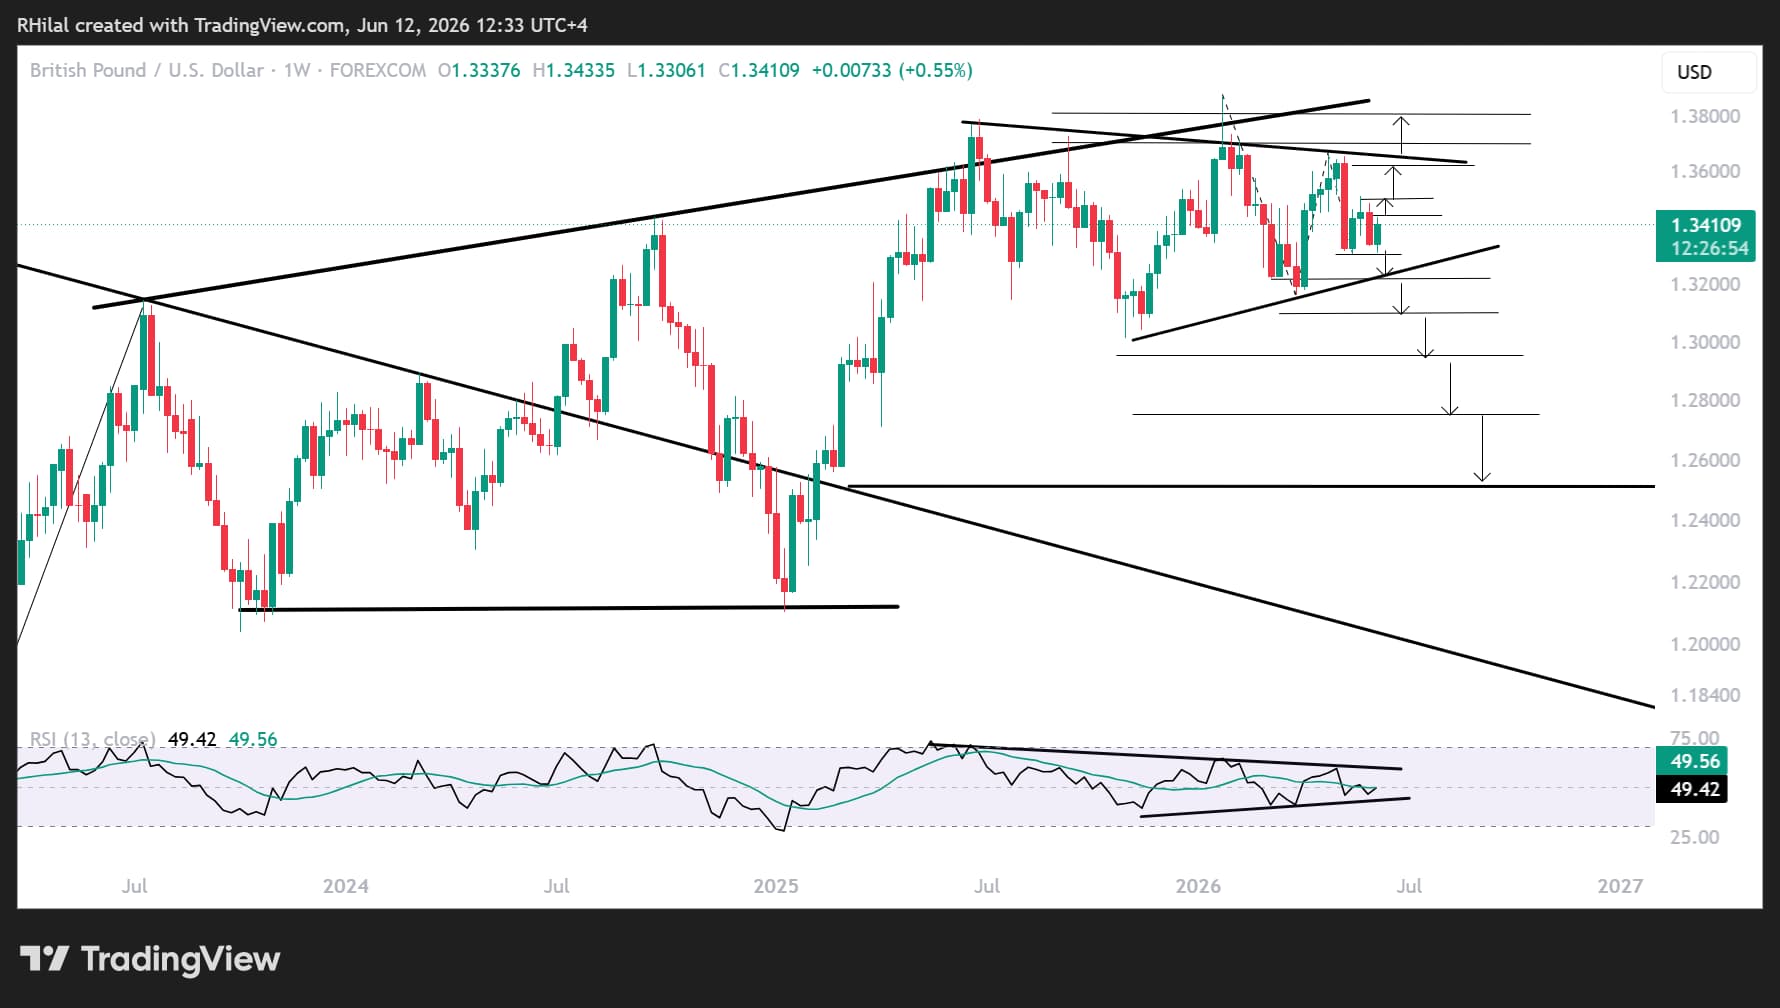
- GBPUSD rebounded more than 100 pips from 1.3320 before pulling back from resistance near 1.3430.
- Nasdaq rebounded more than 1,000 points from 28,600 before encountering resistance around 29,620.
GBPUSD Price Outlook: Weekly Time Frame – Log Scale
Source: TradingView
Broader Technical Framework
GBPUSD remains within a one-year contracting consolidation pattern, which itself sits within a broader consolidation structure that has been developing since 2023. The pair continues to trade below the major resistance zone near 1.38.
Current Support Remains at 1.3320
The 1.3320 level aligns with the 0.618 Fibonacci extension of the January–March–April 2026 cycle and continues to provide an important support zone for a potential rebound.
Key Resistance Levels
The immediate resistance zone is located between 1.3420 and 1.3500, aligning with the 0.382 Fibonacci extension of the March–May 2026 cycle.
Bullish Scenario
A sustained breakout above the 1.3420–1.3500 resistance zone would expose the upper boundary of the consolidation pattern and the next Fibonacci extension levels.
The next upside targets would emerge near:
- 1.3620 - 61.8%
- 1.3700 - 78.6%
- 1.3800 - 100%
A confirmed breakout above 1.38 would strengthen the long-term bullish outlook and expose the major historical highs near:
- 1.4250 - 2021 high
- 1.4320 - 2018 high
Bearish Scenario
A sustained move below 1.3320 would expose the year's ascending support trendline near 1.3200.
This area may provide another rebound opportunity. However, a confirmed breakdown would shift focus toward:
- 1.3100
- 1.2950
- 1.2750
- 1.2500
The 1.2500 level aligns with the 1.618 Fibonacci extension and may offer another attractive long-term bullish positioning opportunity.
Silver Price Outlook: Daily Time Frame – Log Scale
Source: TradingView
Broader Technical Framework
Silver is attempting to recover from the yearly lows near 61. However, price action remains within bearish territory while trading below the key 68–72 resistance zone.
Current Support Zone
The primary support remains at 61, which corresponds to the 2026 low and the 78.6% Fibonacci extension of the March–May cycle.
Current Resistance Zone
The immediate resistance area is located between 68 and 72, aligning with the 0.272 and 0.382 Fibonacci extensions of the March–May–June 2026 cycle.
Bullish Scenario
A sustained breakout above the 68–72 resistance zone would strengthen bullish momentum and expose the following upside targets:
- 72.40
- 75.70
- 79.00 - 61.8%
These levels align with the extension of the March low–May high–June low cycle.
A confirmed breakout beyond these levels would reopen the path toward the 90 region and potentially triple-digit silver prices over the longer term.
Bearish Scenario
A sustained hold below 65.80, followed by a break beneath 63.00, would increase the risk of another retest of the yearly lows.
A confirmed breakdown would expose the next major support levels near:
- 58
- 51
- 48
These levels align with the multi-decade resistance zone that dates back to the 1980s and could potentially transform into long-term support, creating another attractive bullish positioning opportunity.
Written by Razan Hilal, CMT
Follow on X: @Rh_waves







Web Trader platform
Our sophisticated web-based platform is packed with features.
Open an account today
Experience award-winning platforms with fast and secure execution.
Economic calendar
Related articles

Euro Short-term Outlook: EUR/USD Pullback Nears Pivotal Uptrend Support 8 28 2026
Warsh's comments accelerated the EUR/USD selloff, raising the stakes as buyers look to stabilize the broader recovery.


EUR/USD forecast: All eyes on Warsh at Jackson Hole - Forex Friday
For much of this week, the EUR/USD has been edging lower with the US dollar regaining some ground after last week’s sell-off that was triggered, in part, by the bond market worries. Investors have been unwilling to bet further against the US dollar so far this week ahead of Kevin Warsh’s keynote speech at the Jackson Hole summit, due later today.


AUD/CAD breakout puts the Bradman barrier in sight
A bullish breakout has pushed AUD/CAD to its highest level since early 2021. Whether it can clear 0.9994 may determine if the move extends well above parity.
