


Gold and Silver Outlook: Bearish Reversals Signal Further Downside
Gold and silver turn lower as bearish reversal patterns form, with XAU/USD eyeing key support and silver likely to follow the move
Written by
Matt Simpson
Market Analyst
Gold and silver prices are turning lower after bearish reversal patterns emerged across both metals, with fading safe-haven demand and a firmer US dollar weighing on prices. Gold’s failed breakout above 4900 has shifted focus towards key support levels, while silver is showing similar technical weakness.
Positioning is also softening, reinforcing a bearish near-term bias. Any short-term bounce may provide opportunities for sellers to re-enter if resistance holds.
View related analysis:
- Gold Outlook: Rally Slows Near $5000 as Bearish Signals Build
- Australian Dollar Outlook: AUD/USD Hits 0.72 Into RBA, Momentum Fades
- FX Futures Positioning: USD, USD/JPY, GBP/USD, AUD/USD | COT Report
- US Dollar Outlook: Bullish May Seasonality Meets Volatility Risk
- Gold Loses Safe-Haven Appeal as Iran Skips Talks, Ceasefire Extended
Gold Rally Fades as Safe-Haven Demand Eases
My mid-April view that gold’s rally was running out of steam proved on point, with the metal topping out on April 17. Prices were already tracking towards a fourth consecutive weekly gain, but the daily chart had turned choppy, with overlapping candles and limited progress compared to the strong move seen earlier in the month.
Following a failed breakout above 4900, downside momentum accelerated on April 21 after Iran skipped highly anticipated ceasefire talks. However, President Trump extended the ceasefire regardless, effectively removing a key geopolitical risk premium. With safe-haven demand fading, gold has continued to trend lower since.

Source: LSEG
Gold Futures (GC) Technical Analysis
Bearish Reversal Pattern Signals Lower High
The US dollar’s rebound on Monday weighed on gold, which printed a prominent bearish outside day. It also marks the third candle of a 3-bar bearish reversal pattern (evening star), likely confirming Friday’s doji as a lower high within the broader downtrend. The move stalled just shy of the 4700 handle and monthly pivot point.
This brings the 200-day EMA (4406), near prior swing highs and lows, and the 200-day SMA (4355) into focus as initial downside targets. Longer-term volume point of control (VPOC) levels also sit at 4306 and 4180 should the 200-day averages give way.

Key Support Levels and Bounce Scenarios to Watch
The presence of multiple support levels above 4000 raises the possibility that gold could be forming an important swing low above 4100.
On the 4-hour chart, prices held above the weekly S1 pivot, with a small inside bar into the US close hinting at demand around current levels. This opens the door for a minor bounce in Asia or later today, which could provide an opportunity for bears to fade strength—seeking signs of a swing high and a move towards the monthly S1 pivot near 4461.

Source: COMEX, TradingView
Silver Futures (SI) Technical Analysis
A swing high also appears to have formed on the silver daily chart, with Monday’s bearish engulfing candle forming the 2-bar bearish reversal pattern – dark cloud cover. The fact it formed at the 20-day EMA and just below the 50-day EMA adds wright to the near-term bearish case, as does the bearish clues on the gold daily chart.
Bears could target last week’s lows and the $70 handle while silver prices remain beneath Friday’s high (77.52), or seek to fade into retracements within Monday’s range while prices remain beneath the weekly pivot point.

Source: COMEX, TradingView

Gold (GC), Silver (SI) Futures Positioning | COT Report
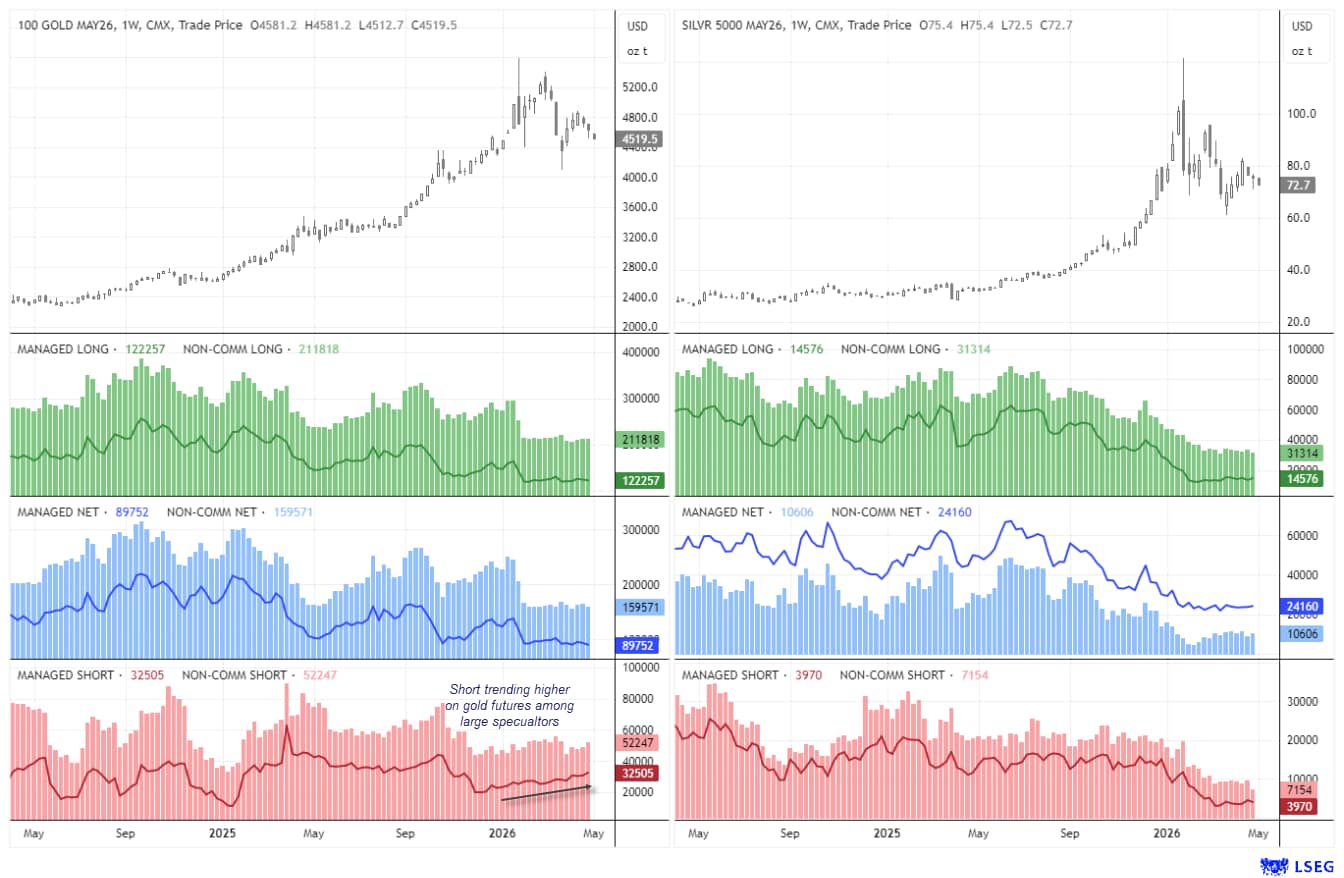
While traders remain net-long gold and silver futures, positioning is low by historical standards and has been trending lower alongside prices. Net-long exposure also peaked well over a year ago. Notably, gross-short exposure to gold is rising among large speculators, while activity in silver suggests traders are gradually stepping away from the market.
If large speculators are correct in increasing bearish bets on gold, it could spell further downside for silver, which typically tracks the yellow metal.
Source: CFTC (COT), COMEX, LSEG
View the full economic calendar
-- Written by Matt Simpson
Follow Matt on Twitter @cLeverEdge
How to trade with City Index
You can trade with City Index by following these four easy steps:
- Open an account, or log in if you’re already a customer
• Open an account in the UK
• Open an account in Australia
• Open an account in Singapore
- Search for the market you want to trade in our award-winning platform
- Choose your position and size, and your stop and limit levels
- Place the trade
Related tags:







Web Trader platform
Our sophisticated web-based platform is packed with features.
Open an account today
Experience award-winning platforms with fast and secure execution.
Economic calendar
Related articles

Euro Short-term Outlook: EUR/USD Pullback Nears Pivotal Uptrend Support 8 28 2026
Warsh's comments accelerated the EUR/USD selloff, raising the stakes as buyers look to stabilize the broader recovery.


Gold and S&P 500 analysis: What now after Warsh’s hawkish speech?
The dollar surged across the board after the Fed Chair Kevin Warsh surprised with a hawkish-leaning speech at the Jackson Hole summit. All the bearish dollar bets that had been accumulated since last Friday on the back of data weakness and bond market troubles had to be squared and that triggered a short squeeze rally for the dollar. Gold and silver dropped, as a result, as too did bitcoin, while US indices were giving back earlier gains.


EUR/USD forecast: All eyes on Warsh at Jackson Hole - Forex Friday
For much of this week, the EUR/USD has been edging lower with the US dollar regaining some ground after last week’s sell-off that was triggered, in part, by the bond market worries. Investors have been unwilling to bet further against the US dollar so far this week ahead of Kevin Warsh’s keynote speech at the Jackson Hole summit, due later today.