

Gold consolidates breakout as bullish case builds
Gold is consolidating its breakout above $4,200. Central bank demand, dollar weakness and improving momentum suggest the move may have more to run.
Written by
David Scutt
Market Analyst
- Gold consolidates after breaking higher last week
- Central bank demand remains broadly supportive
- Elevated US real yields fail to derail gold’s rally
- $4,367 key level overhead
The way gold continued to find buyers on dips beneath $4,000 an ounce through June and July may have been the tell that a larger move was coming, eventually culminating in the sharp breakout seen in early August. The move followed a run of supportive developments, raising the possibility that the breakout could evolve into something more significant depending on how the price action evolves from here.
Supportive forces build behind gold
The July Fed meeting came in dovish relative to what had become fairly hawkish market expectations, with around a one-in-three chance of a rate hike priced beforehand. Yes, three regional presidents dissented in favour of tightening, but there were no dissents from the Board of Governors, helping to knock some of the wind out of the dollar’s sails as rate hike pricing retraced slightly, as seen below.
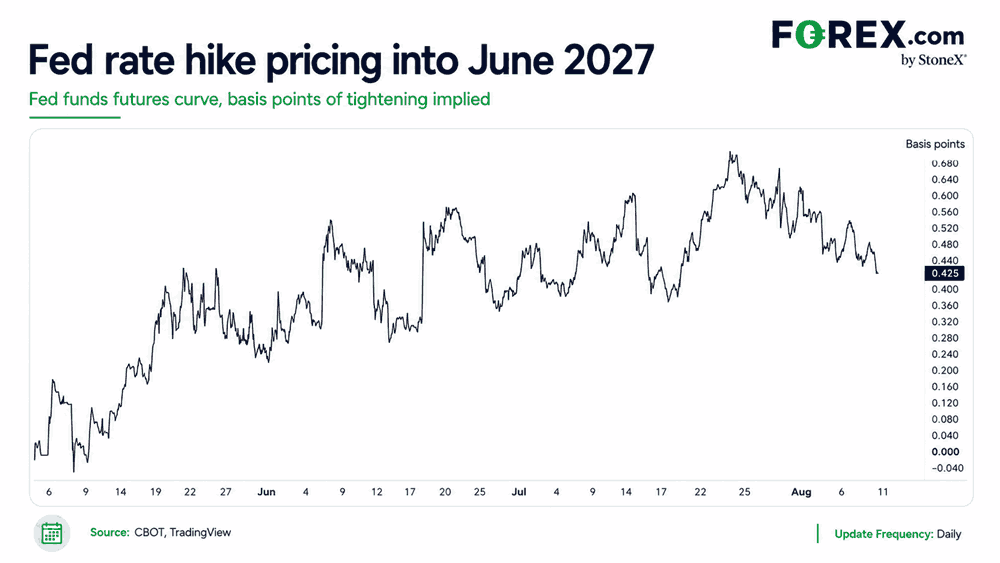
Source: TradingView, FOREX.com
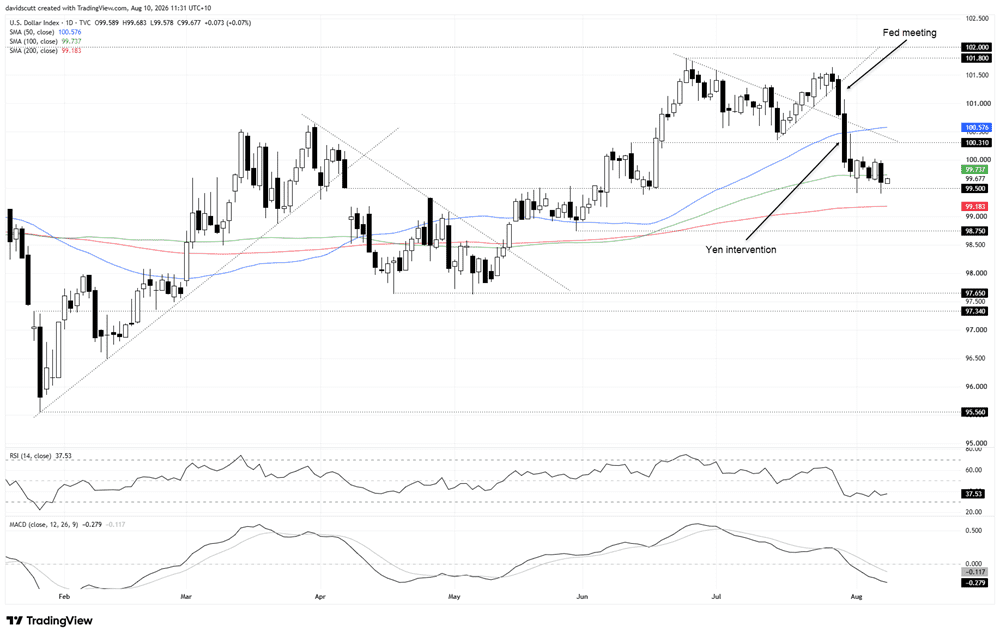
That was followed by the unusual US-Japan intervention episode to support the yen, involving the US Treasury alongside Japan’s Ministry of Finance. The strengthening in the yen added to the pressure already building on the dollar.

Source: TradingView, FOREX.com
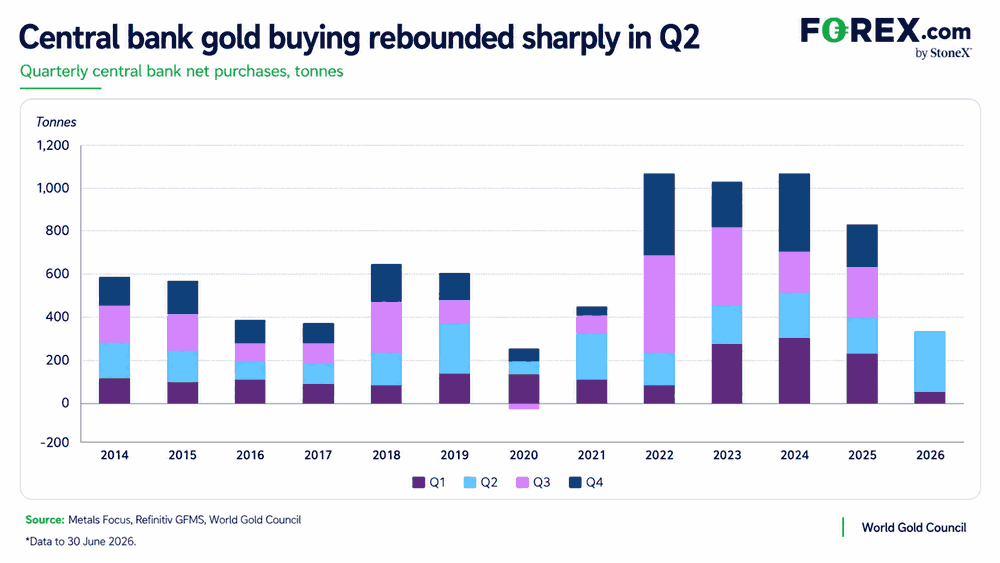
Then came a World Gold Council report, which showed central bank gold demand had picked up sharply in the June quarter, partly reflecting a substantial downward revision to the estimate for Q1. More importantly, reserve managers indicated they broadly expect central banks to keep adding to their holdings, suggesting demand remains supportive around current price levels.
Gold shrugs off elevated real yields
Source: TradingView, FOREX.com
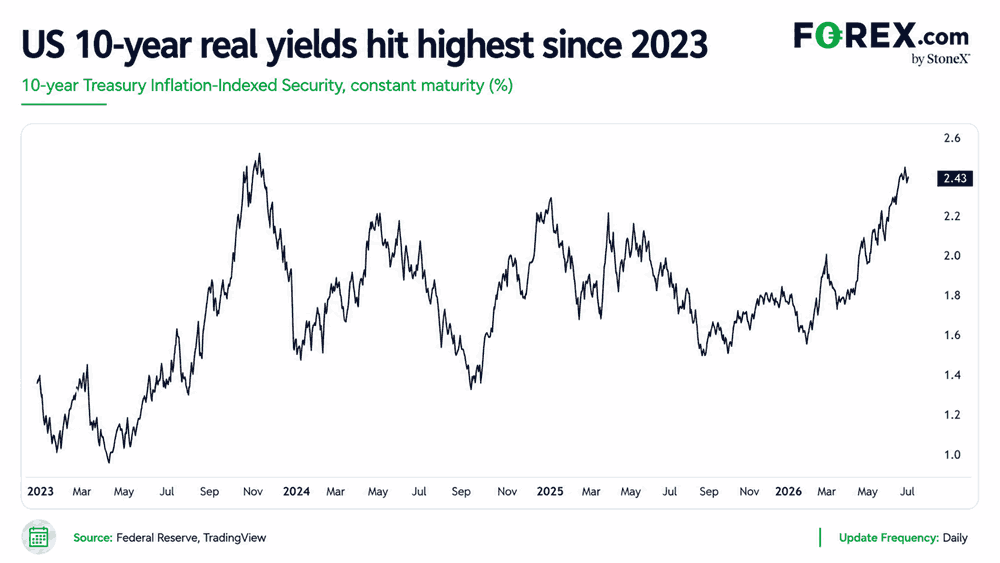
What makes gold's performance all the more interesting is that it has come in an environment where, historically, it may have been expected to struggle, with benchmark US real yields climbing to levels last seen in late 2023, the peak of the Fed’s hawkish phase during its prior tightening cycle. Despite that headwind, non-yielding gold hasn’t wilted, it’s rallied, suggesting factors elsewhere have been more than powerful enough to offset it.
Source: TradingView
One of those factors has been the US dollar. After breaking lower following the Fed and intervention episode, the DXY has since settled into a relatively narrow sideways range. With key US inflation data due later this week, that consolidation suggests gold’s rebound may take a breather in the very near term.
Gold consolidates its breakout
Source: TradingView
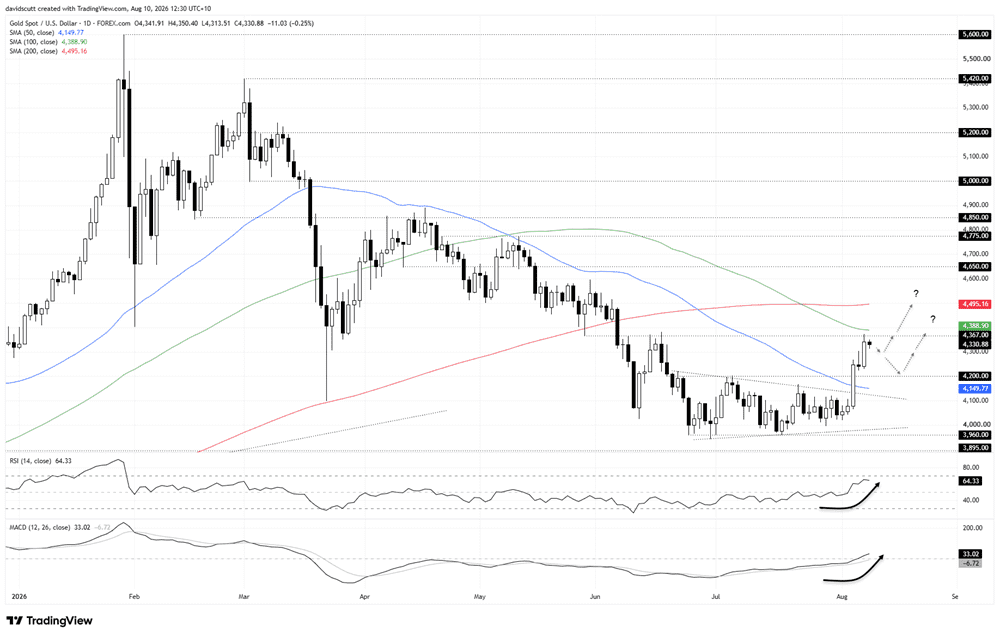
Turning to the technical picture, we’ve seen the longer-term sequence of lower highs running from the record highs broken. That coincided with a breakout of the compression structure that had been forming over recent months, seeing the price not only rip through wedge resistance and the 50-day simple moving average last week, but also $4,200. From that moment onwards, the price went on to tag $4,367 per ounce, the low set back in late May which reverted to resistance in June. It's the key level to watch overhead right now.
On the downside, the breakout zone around $4,200 remains important, although $4,300 an ounce did briefly cap the breakout last week, making it relevant as well. So they’re the levels I’d be keeping an eye on underneath where gold now trades.
The message from the oscillators favours an extension of the bullish move. RSI is making higher highs and higher lows, while not yet being overbought, sitting above the neutral 50 level at 63. That shows bullish momentum is building, a message confirmed by MACD which has staged a bullish crossover and flipped positive. So buying dips is the preferred strategy right now.
If we see a breakout above $4,367, preferably on a closing basis, it would allow for longs to be set above with a tight stop beneath for protection, targeting the 100-day simple moving average initially, with the far more important 200-day moving average the next overhead at $4,495.
Alternatively, if the modest pullback we’ve seen in Asia today retraces further, take note of the price action at $4,300 and $4200. If there is evidence that buyers emerge on dips towards those levels, they too could be used to set longs above with a stop beneath for protection, targeting $4,367 and 100-day moving average initially.
If we were to see a reversal back beneath $4,200 per ounce, it would question the bullish bias and open the door for sideways to lower levels.
Latest market news










Web Trader platform
Our sophisticated web-based platform is packed with features.
Open an account today
Experience award-winning platforms with fast and secure execution.
Economic calendar
Related articles

Gold and S&P 500 analysis: What now after Warsh’s hawkish speech?
The dollar surged across the board after the Fed Chair Kevin Warsh surprised with a hawkish-leaning speech at the Jackson Hole summit. All the bearish dollar bets that had been accumulated since last Friday on the back of data weakness and bond market troubles had to be squared and that triggered a short squeeze rally for the dollar. Gold and silver dropped, as a result, as too did bitcoin, while US indices were giving back earlier gains.


EUR/USD forecast: All eyes on Warsh at Jackson Hole - Forex Friday
For much of this week, the EUR/USD has been edging lower with the US dollar regaining some ground after last week’s sell-off that was triggered, in part, by the bond market worries. Investors have been unwilling to bet further against the US dollar so far this week ahead of Kevin Warsh’s keynote speech at the Jackson Hole summit, due later today.

Bitcoin Forecast: BTC/USD Back to $80K Ahead of Warsh’s Jackson Hole Speech
After surging over $15,000 in the past 10 days alone, there is risk of a near-term pullback if Warsh says anything remotely hawkish at Jackson Hole - what are the levels to watch from here?
