


Gold Futures Look Set To Bounce From 4000, Though Headwinds Remain
Gold futures are showing signs of a short-term bounce off 4000, but mixed options flows and resistance overhead suggest the recovery may be limited.
Written by
Matt Simpson
Market Analyst
Gold futures are attempting to stabilise above the 4000 level after a sharp pullback, with early signs that a short-term rebound may be forming. Options markets show medium-term bullish positioning, yet short-dated skews remain negative — hinting that gains could be capped initially. Technicals on the weekly and daily charts point to a potential recovery phase, but multiple resistance layers suggest that bulls may still face challenges before any sustained move higher.
View related analysis:
Gold options traders display a mixed message
Risk reversals track the balance between bullish call demand and bearish put demand, with a rising line signalling expectations of higher prices. Notably, the 1- and 3-month RRs broke to new cycle highs last week ahead of spot, hinting that options traders may be positioning for gold to eventually break higher over those timeframes.
The 1-week RR, however, remains negative — showing puts still outweigh calls in the very near term. Short-dated signals are noisy, but it’s a reminder not to assume an immediate runaway breakout. Even so, a tactical long setup could be forming, even if gold initially struggles to clear last week’s high.
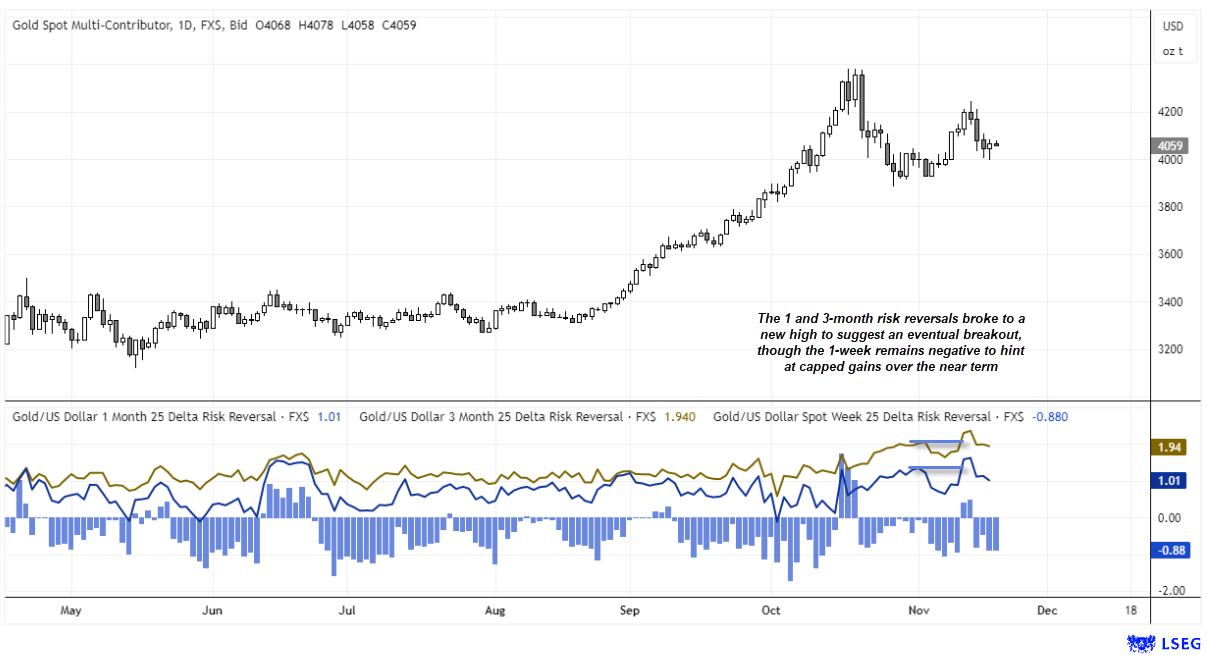
Chart analysis by Matt Simpson, Source: LSEG
Gold Futures Technical Outlook
The weekly chart hints we may have completed the first leg of a potential three-wave correction in gold. Prices held above 4000 last week, but the sizeable upper wick shows bulls surrendered much of their early gains. A short-term recovery is possible while Wave B develops, before a potential Wave C leg lower.
If Wave B were to stall near 4300, a symmetric move (Wave A = Wave C) would imply a downside target closer to 3800. For now, the focus is on the bullish setup forming on the daily chart.

Daily Signals Hint at Short-Term Rebound for Gold
The daily chart shows a second consecutive bullish hammer formed. While the daily RSI (2) is not oversold, it is close enough to consider a swing low is near, if not seen already.
A break above Tuesday’s high (4084) also clears the monthly pivot point and brings the 4200 handle and 4250 high into focus. A break above which opens up a run for 4300, near the monthly R1.
I can then reconsider the potential for a swing high to form around such resistance levels in anticipation of a move back down to 4000 and 3800.
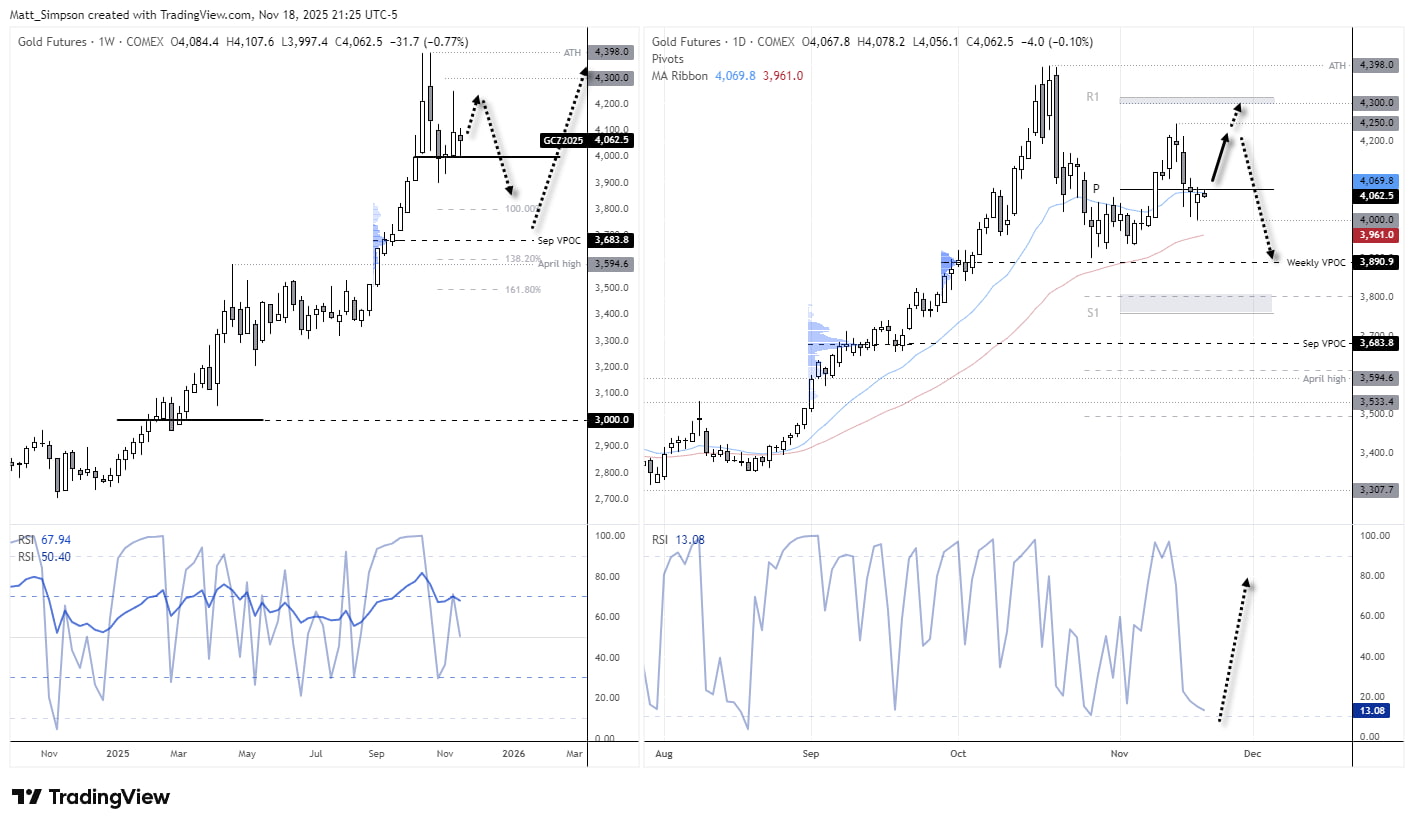
Chart analysis by Matt Simpson, Source: TradingView, COMEX Futures, Gold
View the full economic calendar
-- Written by Matt Simpson
Follow Matt on Twitter @cLeverEdge
How to trade with City Index
You can trade with City Index by following these four easy steps:
- Open an account, or log in if you’re already a customer
• Open an account in the UK
• Open an account in Australia
• Open an account in Singapore
- Search for the market you want to trade in our award-winning platform
- Choose your position and size, and your stop and limit levels
- Place the trade
Related tags:







Web Trader platform
Our sophisticated web-based platform is packed with features.
Open an account today
Experience award-winning platforms with fast and secure execution.
Economic calendar
Related articles

Euro Short-term Outlook: EUR/USD Pullback Nears Pivotal Uptrend Support 8 28 2026
Warsh's comments accelerated the EUR/USD selloff, raising the stakes as buyers look to stabilize the broader recovery.


Gold and S&P 500 analysis: What now after Warsh’s hawkish speech?
The dollar surged across the board after the Fed Chair Kevin Warsh surprised with a hawkish-leaning speech at the Jackson Hole summit. All the bearish dollar bets that had been accumulated since last Friday on the back of data weakness and bond market troubles had to be squared and that triggered a short squeeze rally for the dollar. Gold and silver dropped, as a result, as too did bitcoin, while US indices were giving back earlier gains.


EUR/USD forecast: All eyes on Warsh at Jackson Hole - Forex Friday
For much of this week, the EUR/USD has been edging lower with the US dollar regaining some ground after last week’s sell-off that was triggered, in part, by the bond market worries. Investors have been unwilling to bet further against the US dollar so far this week ahead of Kevin Warsh’s keynote speech at the Jackson Hole summit, due later today.