


Gold Price Rebound? Futures Positioning Signals Support Above 4,000
Gold's selloff may be nearing exhaustion as futures positioning improves, bearish bets collapse and support above 4,000 continues to hold.
Written by
Matt Simpson
Market Analyst
Gold prices are on track for a fourth consecutive monthly decline, yet several indicators suggest bearish momentum may be fading. Extreme seasonality readings, improving futures positioning and resilient options market sentiment all point to the potential for another rebound while support above 4,000 remains intact.
View related analysis:
Gold Holds Above 4,000 as Positioning and Technical Signals Improve
Gold Bulls To Eye Another Rebound?
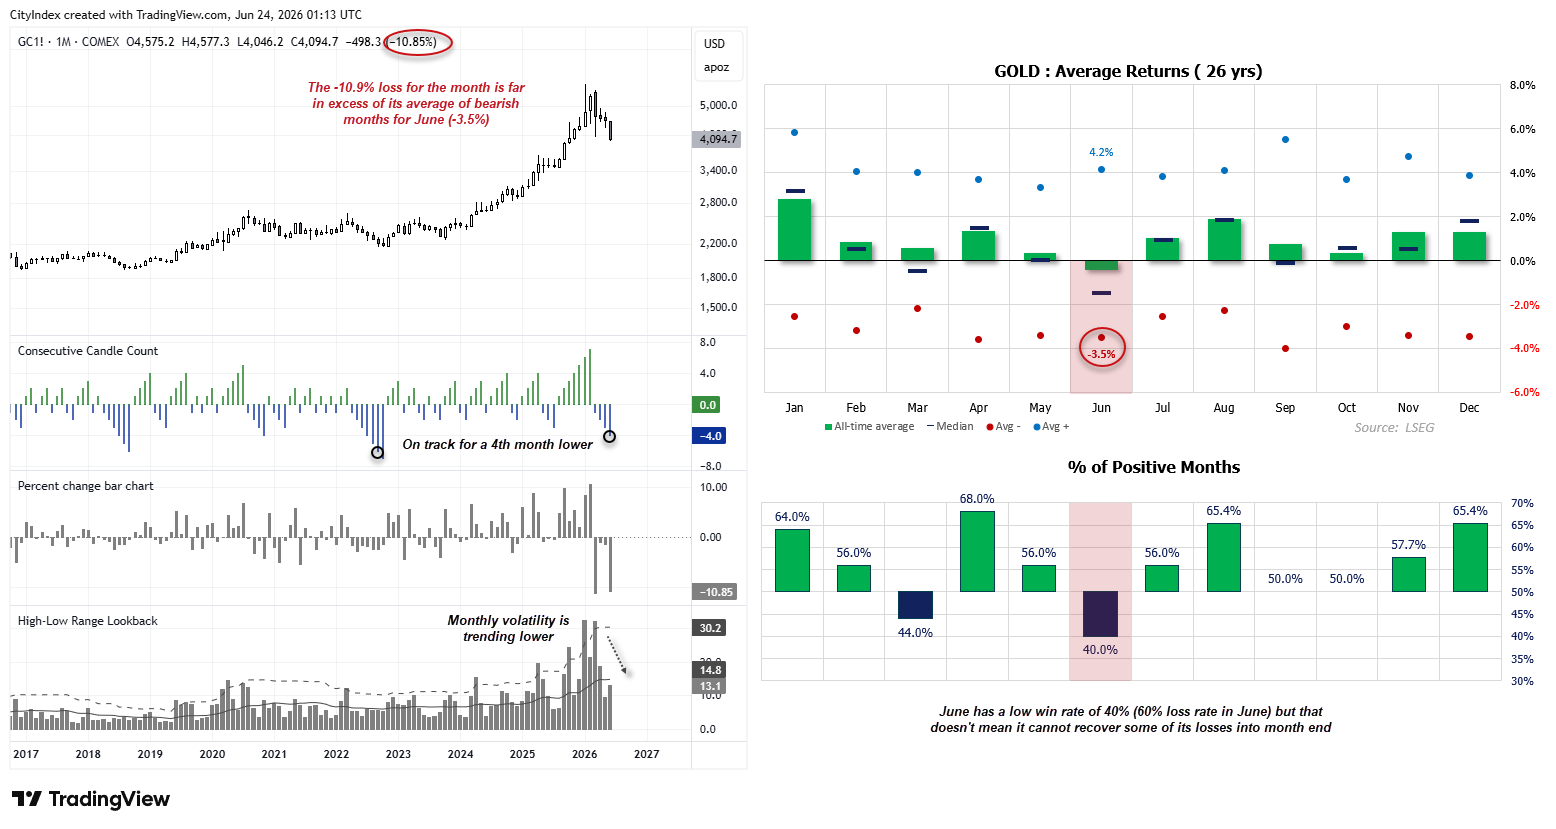
On June 11, I outlined the case for a bullish mean-reversion move in gold. At the time, I noted that gold prices had fallen more than 10% in June, far exceeding the average decline of -3.5% seen during bearish Junes since 2000. And that was before the month had reached its halfway point. With the 4,000 milestone providing nearby support, the odds appeared to favour a rebound. I'm pleased to say the low was identified to the day, and a similar setup now appears to be emerging.
Gold remains on track for a fourth consecutive monthly decline — its longest bearish streak since September 2022. Yet it is once again lower by more than 10% for the month, putting it on course for its second-worst monthly performance of the century. At the same time, monthly volatility continues to trend lower despite elevated price swings, which could be interpreted as a crude sign that conditions are becoming more stable.
Source: COMES, TradingView, LSEG
Gold's June Decline Stretches Historical Extremes
Seasonality shows June is typically a bearish month for gold, delivering a negative average and median return alongside a relatively low win rate. Since 2000, gold has declined in 60% of Junes, with those bearish months posting an average return of -3.5%. Therefore, the fact that gold is already down more than 10% this month while continuing to hold above support suggests it may be able to claw back at least some of those losses before month-end.
Gold Futures (GC) Market Positioning | COT Report
Gold Shorts Collapse as Positioning Improves
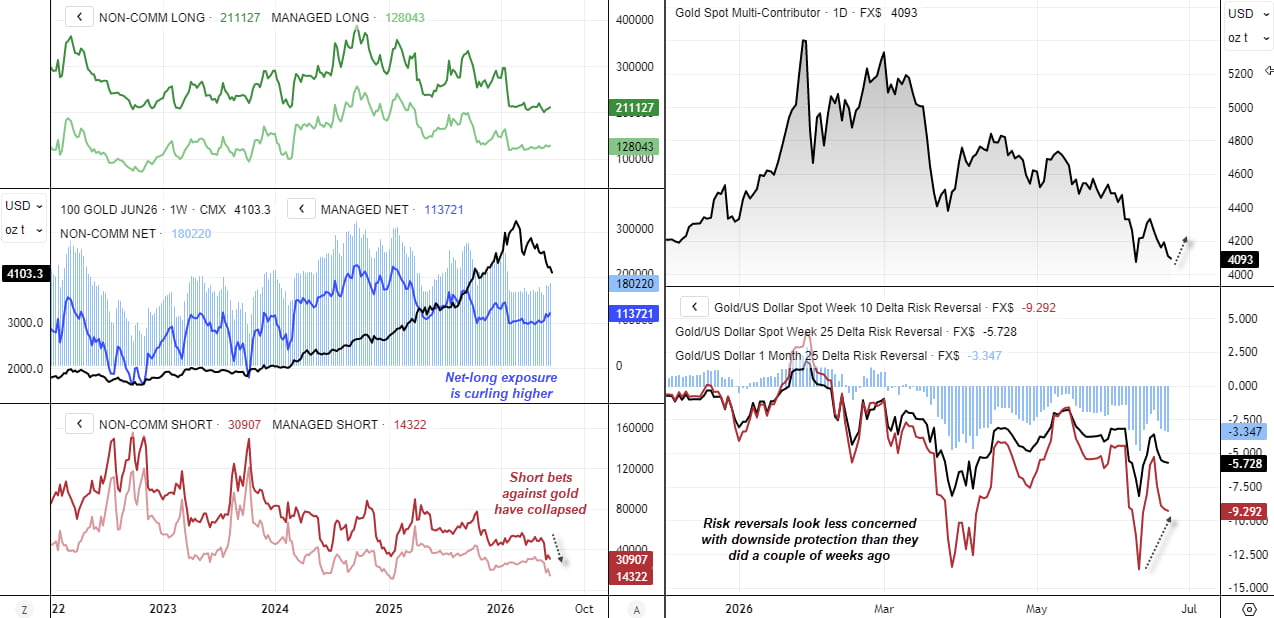
It should also be noted that bearish bets against gold have collapsed on the CME futures market. Gross shorts among managed funds have fallen to their lowest level since 2022, while large speculators hold their fewest short positions since January 2025. Although gross longs remain low by historical standards, they have been gradually increasing, helping to lift net-long exposure among both groups.
Open interest has also trended lower in recent months, suggesting the decline in gold prices was not primarily driven by aggressive new short selling. Instead, the move appears to have been characterised by both long and short positions being unwound. However, total open interest has edged higher over the past couple of weeks, hinting at potential accumulation as gold continues to hold above the 4,000 level.
For traders wanting a deeper understanding of futures positioning, I’ve also published a guide on how to read and interpret weekly COT data in forex markets.
Options Markets Hint at Underlying Resilience
Furthermore, risk reversals remain above their recent lows and trade at higher levels relative to those lows compared with prices. This could be deemed a positive divergence between options traders and spot gold prices. Ultimately, demand for puts relative to calls is nowhere near as strong as it was a few weeks ago. Which again, provides a clue that gold may not be ready to break below 4,000.
Source: CFTC (COT), COMEX, LSEG
This content was created by an affiliate of FOREX.com and represents the views and opinions of the author/speakers, not the views and opinions of FOREX.com, StoneX Group Inc., or its subsidiaries. The content has not been independently reviewed by FOREX.com.
Gold Futures (GC) Technical Analysis
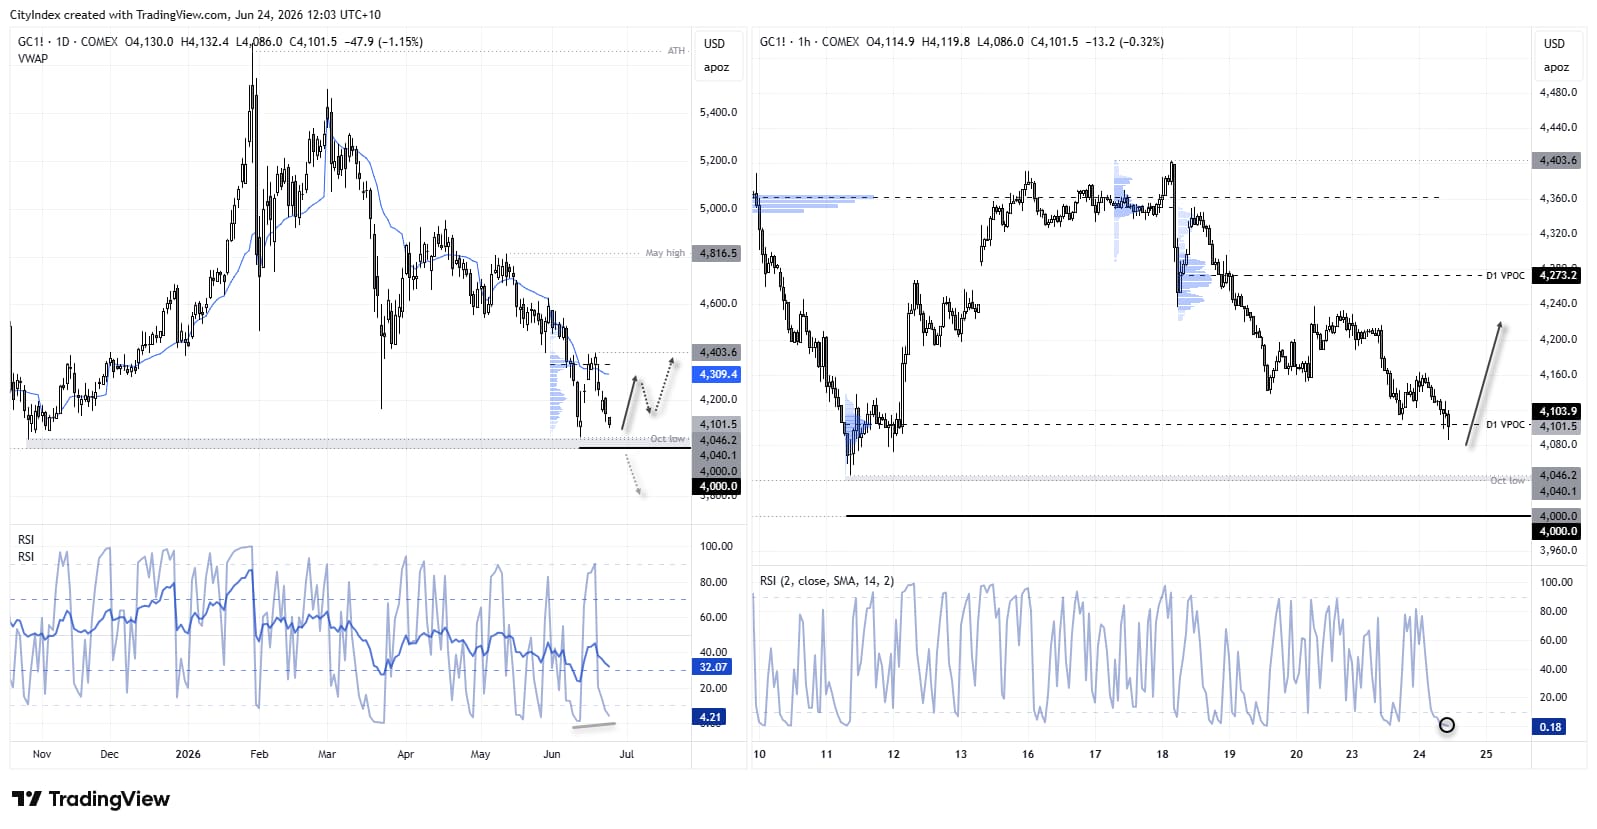
The daily chart shows prices have pulled back from the rebound towards 4,400, although downside momentum appears to be fading and the daily RSI (2) is oversold. If gold can hold above the October low into today's close, it would confirm a higher low and provide a bullish signal for the near term. While the US dollar continues to rally, it is also approaching key resistance levels of its own, raising the possibility that gold could establish a trough above 4,000.
The 1-hour chart shows prices attempting to hold above the daily VPOC (volume point of control). Bulls may want to wait for stronger evidence that a swing low has formed, but while gold remains above 4,000, the potential remains for a rebound towards 4,200, 4,300, or even the 4,400 high. Such a move could unfold while the broader bearish trend on the daily chart remains intact.
Source: COMEX, TradingView
Related tags:







Web Trader platform
Our sophisticated web-based platform is packed with features.
Open an account today
Experience award-winning platforms with fast and secure execution.
Economic calendar
Related articles

Euro Short-term Outlook: EUR/USD Pullback Nears Pivotal Uptrend Support 8 28 2026
Warsh's comments accelerated the EUR/USD selloff, raising the stakes as buyers look to stabilize the broader recovery.


Gold and S&P 500 analysis: What now after Warsh’s hawkish speech?
The dollar surged across the board after the Fed Chair Kevin Warsh surprised with a hawkish-leaning speech at the Jackson Hole summit. All the bearish dollar bets that had been accumulated since last Friday on the back of data weakness and bond market troubles had to be squared and that triggered a short squeeze rally for the dollar. Gold and silver dropped, as a result, as too did bitcoin, while US indices were giving back earlier gains.


EUR/USD forecast: All eyes on Warsh at Jackson Hole - Forex Friday
For much of this week, the EUR/USD has been edging lower with the US dollar regaining some ground after last week’s sell-off that was triggered, in part, by the bond market worries. Investors have been unwilling to bet further against the US dollar so far this week ahead of Kevin Warsh’s keynote speech at the Jackson Hole summit, due later today.