

Gold’s $4k Bent but Not Yet Broken on a Weekly Close Basis
Gold has come a long way from the $5600 highs of six months ago but so far buyers haven’t shown a willingness to relinquish the $4k handle as repeated tests have, so far, led to a stalling in the trend.
Written by
James Stanley
Sr. Strategist
Gold Talking Points:
- While rate cuts amidst high inflation drove a massive breakout in gold back in 2024 the possibility of inflation-fueled rate hikes has driven a 28% pullback in the metal.
- The $4k level was initially taken-out last October as rate cuts fueled the rally but that price has become a massive spot of contention with buyers stepping in on tests below over the past month.
It’s been a brutal four-month stretch for Gold and that statement really can be spanned back to six months, as it was January 29th when the metal had set its current all-time-high just below $5600/oz. The initial pullback from that move was violent, with prices testing just above the $4400 handle a few days later, but that move was bid as late-stage buyers posed a bounce, and that move inevitably topped out at a lower-high of $5400/oz in early-March.
Since then, sellers have very much been in-charge with lower-lows and lower-highs, but over the past month they’ve largely been stalled as we’ve seen continued buying interest upon tests below the $4k level.
Gold Weekly Chart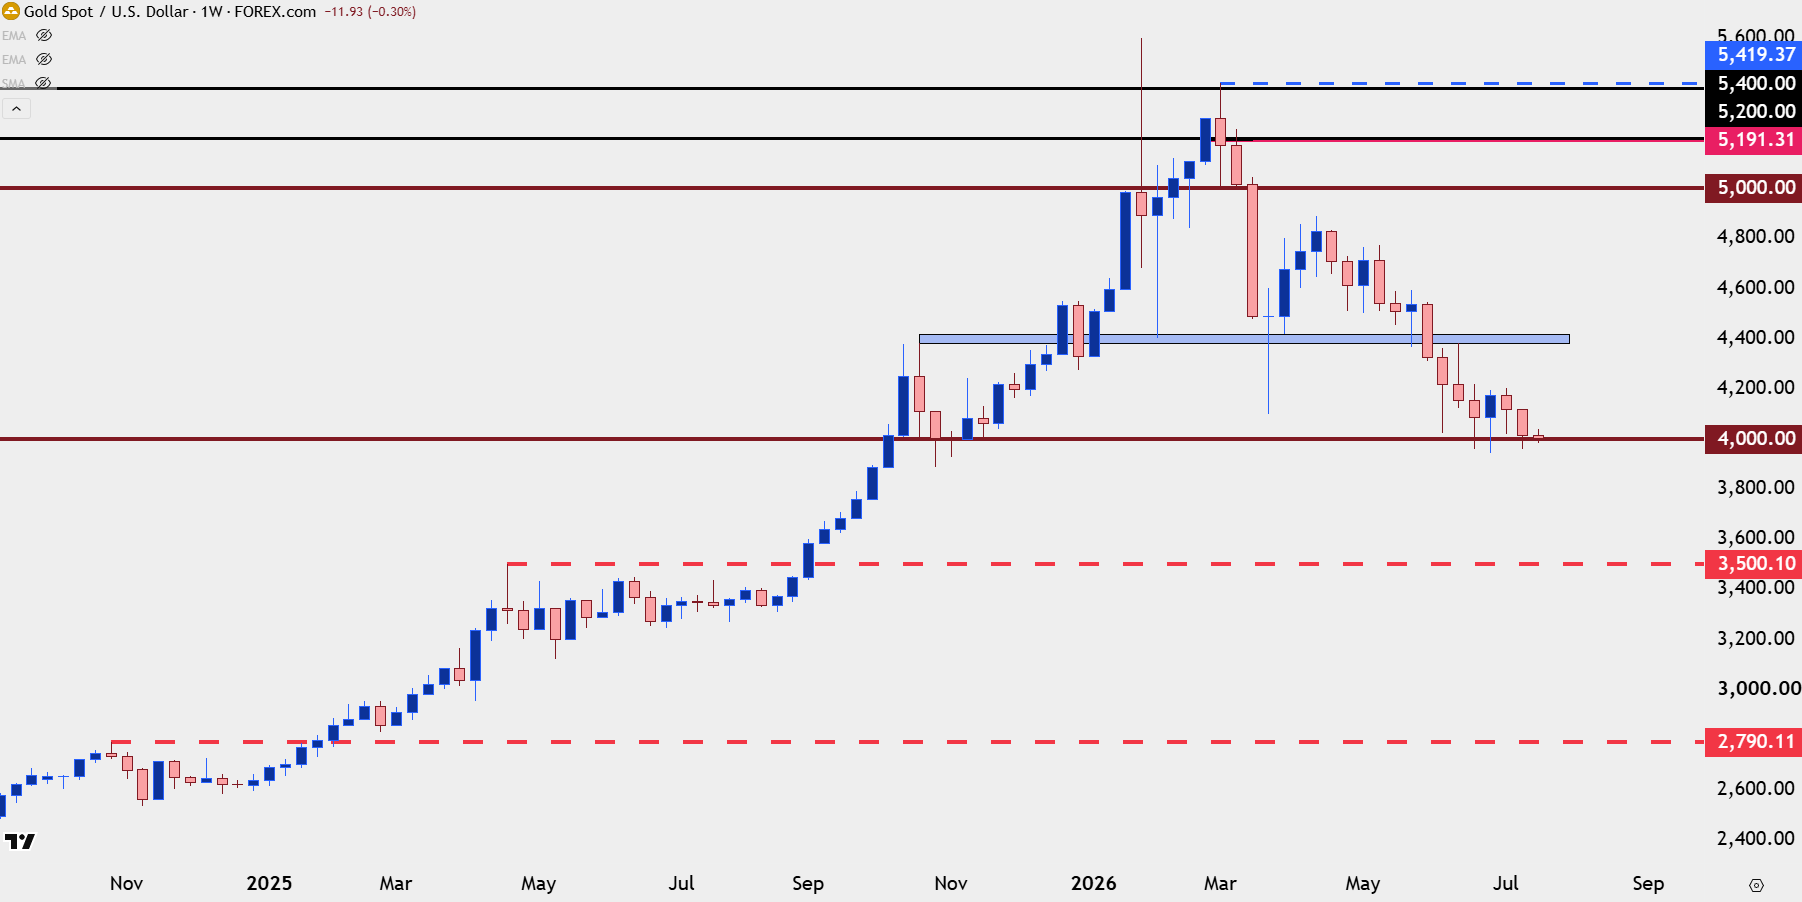
Chart prepared by James Stanley; data derived from Tradingview
Gold: All About $4k
On the initial approach towards the $4k level back in March, buyers stepped in about $100 before the big figure could come into play. That bounce, like the bounce from the $5600 reversal, was faded by sellers, leaving another lower-high on the chart. In the four months since, buyers have continued to show demand around the $4k level although that’s been slipping of late.
As to where sellers have been showing more aggression, we have lower-highs at both $4200 and $4100 and that sets up for some important context as the $4k support test from the weekly chart has continued, as each of those prices represent waypoints that buyers will need to take out to exhibit greater control of the trend in Gold.
Gold Four-Hour Price Chart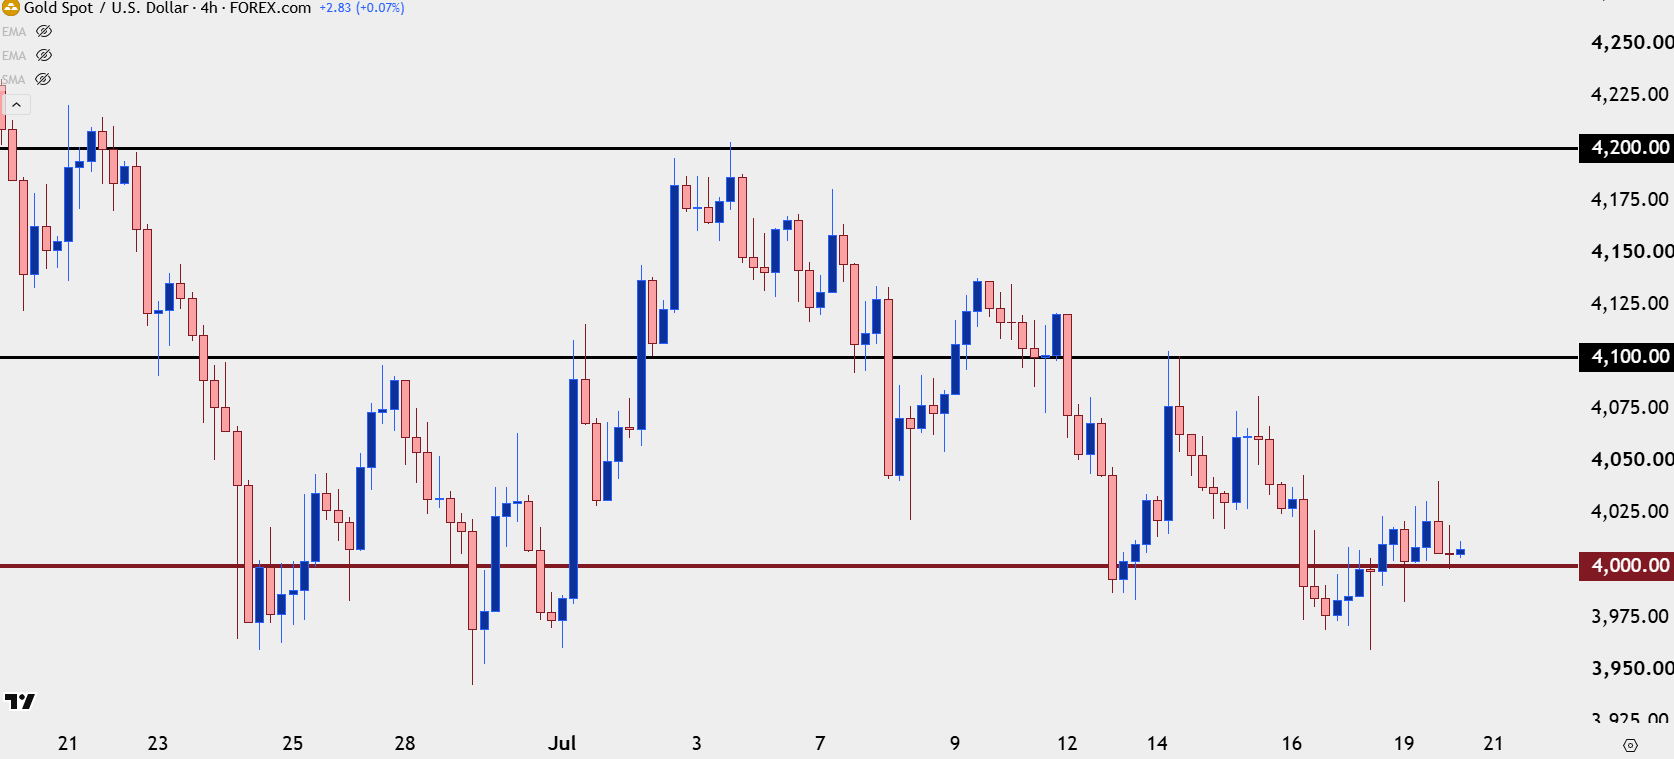
Chart prepared by James Stanley; data derived from Tradingview
Gold Strategy Moving Forward
Last week saw two tests and failures at $4100 following below expected inflation data out of the US, and this further indicates that sellers are using bounces to build positions in the metal. When that sees initial signs of change, then we can begin to plot for bigger picture bullish themes, with that price and $4200 both representing important spots on the chart with which sellers have so far exhibited control.
Outside of that, sellers have an open door to make a move as the daily chart can be argued as a descending triangle formation, which is a bearish continuation pattern marked by horizontal support to go along with lower-highs. The logic being that successive bounces from that horizontal support are bringing less and less buying activity, and a persistent effort from sellers can, eventually, play through to a downside break of that important line-in-the-sand.
In that bearish scenario, spots of prior resistance-turned-support stand out, just below both $3900 and $3800, with the levels specifically plotted at $3895 and $3791.
Gold Daily Chart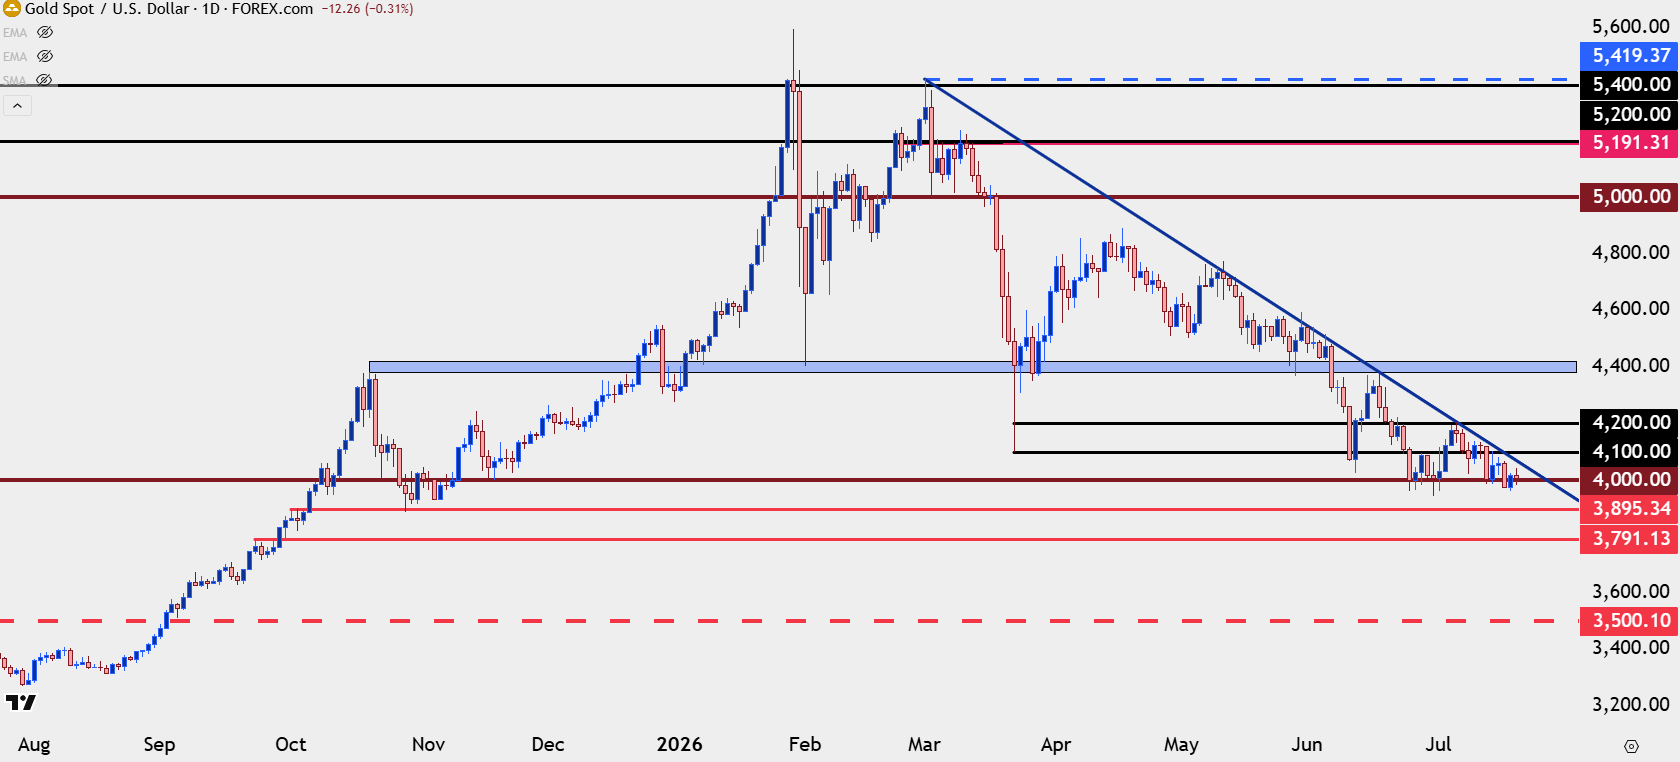
Chart prepared by James Stanley; data derived from Tradingview
--- written by James Stanley, Senior Market Analyst, Global Macro







Web Trader platform
Our sophisticated web-based platform is packed with features.
Open an account today
Experience award-winning platforms with fast and secure execution.
Economic calendar
Related articles

Gold and S&P 500 analysis: What now after Warsh’s hawkish speech?
The dollar surged across the board after the Fed Chair Kevin Warsh surprised with a hawkish-leaning speech at the Jackson Hole summit. All the bearish dollar bets that had been accumulated since last Friday on the back of data weakness and bond market troubles had to be squared and that triggered a short squeeze rally for the dollar. Gold and silver dropped, as a result, as too did bitcoin, while US indices were giving back earlier gains.


Gold Pullback Risk Builds as AUD/USD and USD/CAD Set Up
Gold has stalled near major resistance after a powerful rally, while AUD/USD looks stretched and USD/CAD attempts to extend its rebound.


Gold Falters at Resistance, Grappling With PCE, Month-End Flows and Jackson Hole
Gold has pulled back from resistance after sticky PCE data, with month-end flows and Jackson Hole now shaping the near-term outlook.